数据分析处理问题小例子(wine数据集)
刚学数据分析时做的小例子,从notebook上复制过来,留个纪念~
数据集是从UCI上download下来的Wine数据集,下载地址,这是一个多分类问题,类别标签为1,2,3。
先瞅瞅数据,
import numpy as np
import pandas as pd
from sklearn.linear_model import LogisticRegression   #逻辑斯特回归,线性分类
from sklearn.linear_model import SGDClassifier        #随机梯度参数估计
from sklearn.svm import LinearSVC                     #支持向量机
from sklearn.naive_bayes import MultinomialNB         #朴素贝叶斯
from sklearn.neighbors import KNeighborsClassifier    #K近邻
from sklearn.tree import DecisionTreeClassifier       #决策树
from sklearn.ensemble import RandomForestClassifier   #随机森林
from sklearn.ensemble import GradientBoostingClassifier   #梯度提升决策树
from sklearn.naive_bayes import GaussianNB
from sklearn.ensemble import ExtraTreesClassifier

from sklearn.preprocessing import MinMaxScaler   #最大最小归一化
from sklearn.preprocessing import StandardScaler   #标准化
from scipy.stats import pearsonr                    #皮尔森相关系数
from sklearn.model_selection import train_test_split     #划分数据集
from sklearn.model_selection import cross_val_score
import matplotlib.pyplot as plt
import seaborn as sns
from sklearn.decomposition import PCA
#计算排列和组合数所需要的包
from itertools import combinations
from scipy.special import comb

columns=['0Alcohol','1Malic acid ','2Ash','3Alcalinity of ash',
         '4Magnesium','5Total phenols','6Flavanoid',
         '7Nonflavanoid phenols','8Proanthocyanins ','9Color intensity ','10Hue ','11OD280/OD315 of diluted wines' ,'12Proline ','13category']
data= pd.read_csv("G:/feature_code/wine_data.csv",header=None,names=columns)
data.shape
(178, 14)
显示前五行,
data.head()| 0Alcohol | 1Malic acid | 2Ash | 3Alcalinity of ash | 4Magnesium | 5Total phenols | 6Flavanoid | 7Nonflavanoid phenols | 8Proanthocyanins | 9Color intensity | 10Hue | 11OD280/OD315 of diluted wines | 12Proline | 13category | |
|---|---|---|---|---|---|---|---|---|---|---|---|---|---|---|
| 0 | 14.23 | 1.71 | 2.43 | 15.6 | 127 | 2.80 | 3.06 | 0.28 | 2.29 | 5.64 | 1.04 | 3.92 | 1065 | 1 |
| 1 | 13.20 | 1.78 | 2.14 | 11.2 | 100 | 2.65 | 2.76 | 0.26 | 1.28 | 4.38 | 1.05 | 3.40 | 1050 | 1 |
| 2 | 13.16 | 2.36 | 2.67 | 18.6 | 101 | 2.80 | 3.24 | 0.30 | 2.81 | 5.68 | 1.03 | 3.17 | 1185 | 1 |
| 3 | 14.37 | 1.95 | 2.50 | 16.8 | 113 | 3.85 | 3.49 | 0.24 | 2.18 | 7.80 | 0.86 | 3.45 | 1480 | 1 |
| 4 | 13.24 | 2.59 | 2.87 | 21.0 | 118 | 2.80 | 2.69 | 0.39 | 1.82 | 4.32 | 1.04 | 2.93 | 735 | 1 |
data.info()RangeIndex: 178 entries, 0 to 177 Data columns (total 14 columns): 0Alcohol 178 non-null float64 1Malic acid 178 non-null float64 2Ash 178 non-null float64 3Alcalinity of ash 178 non-null float64 4Magnesium 178 non-null int64 5Total phenols 178 non-null float64 6Flavanoid 178 non-null float64 7Nonflavanoid phenols 178 non-null float64 8Proanthocyanins 178 non-null float64 9Color intensity 178 non-null float64 10Hue 178 non-null float64 11OD280/OD315 of diluted wines 178 non-null float64 12Proline 178 non-null int64 13category 178 non-null int64 dtypes: float64(11), int64(3) memory usage: 19.5 KB
数据说明: 共178条记录,数据没有空缺值,还可以通过describe()方法看数据,主要关注mean这个,对数据分布有个大体的了解。 然后再看数据样本是否均衡
data['13category'].value_counts()2 71 1 59 3 48 Name: 13category, dtype: int64
样本较为均衡,差别不大
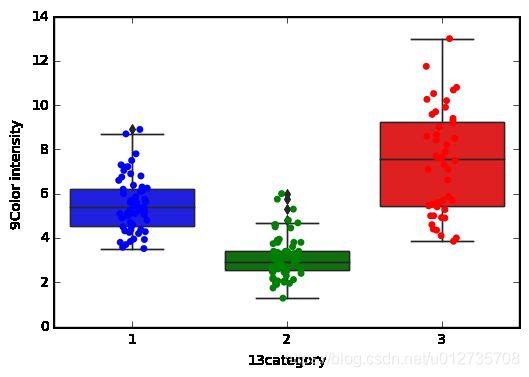
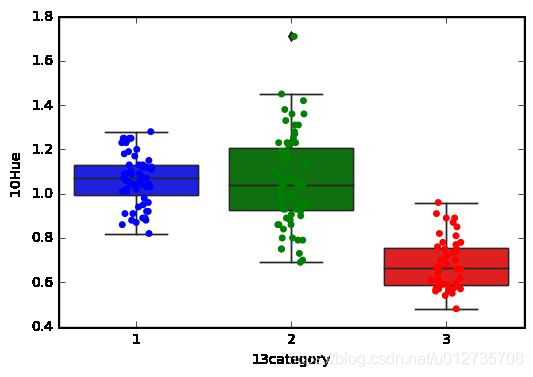
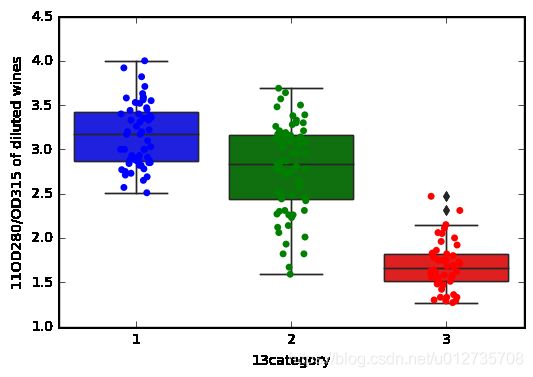
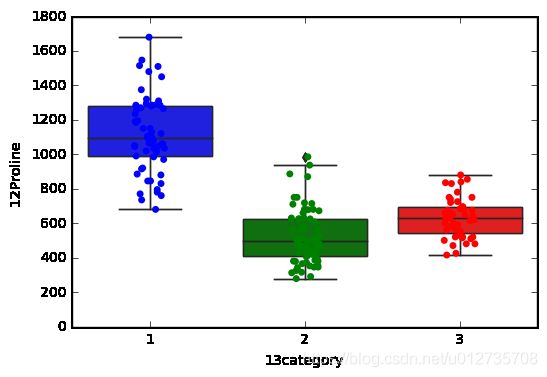
for i in data.iloc[:,0:13].columns:
    sns.boxplot(x = data['13category'],y = data[i])
    ax = sns.boxplot(x='13category', y=i, data=data)
    ax = sns.stripplot(x='13category', y=i, data=data, jitter=True, edgecolor="gray")
    plt.show()
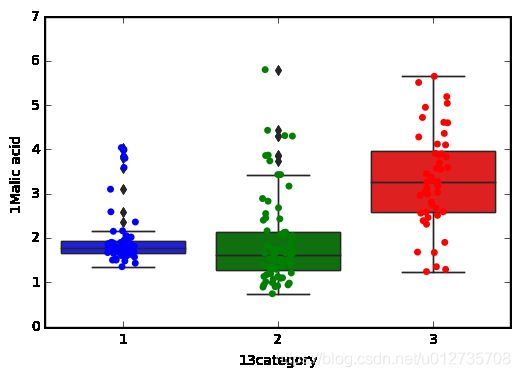
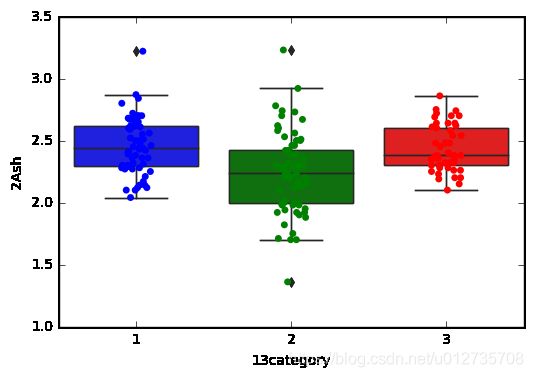
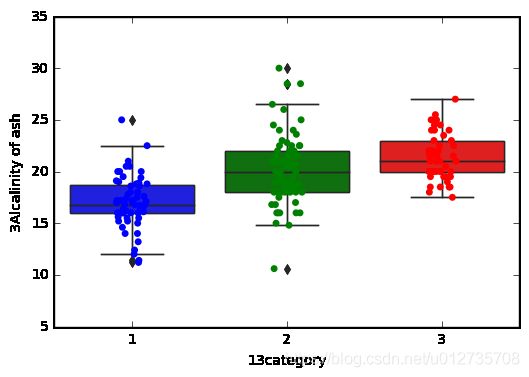
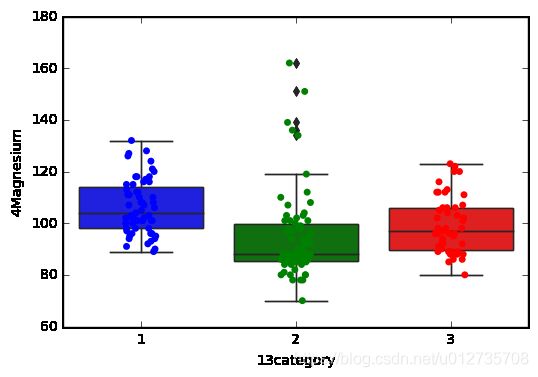
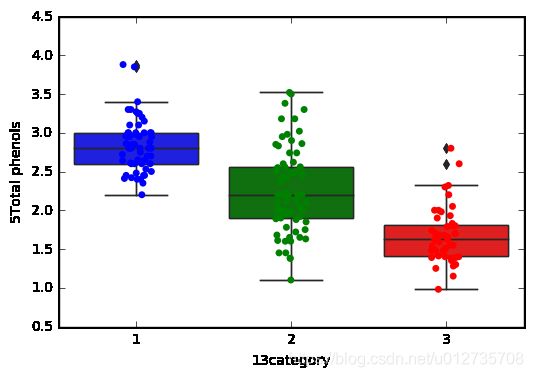
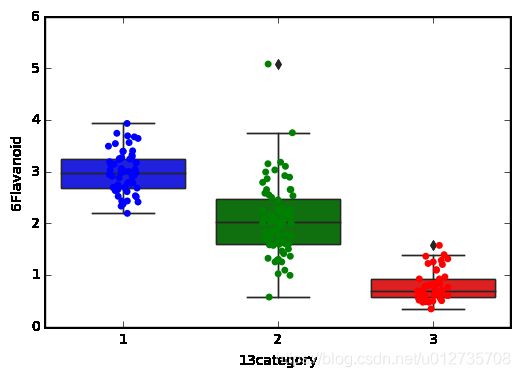
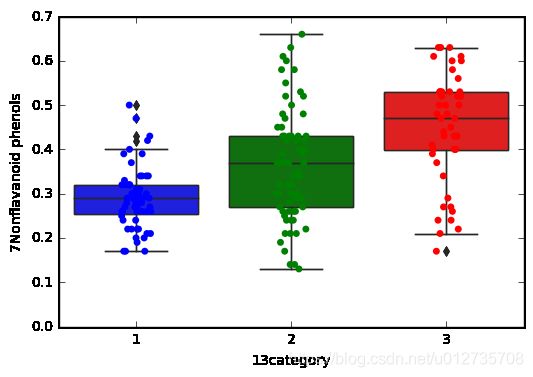
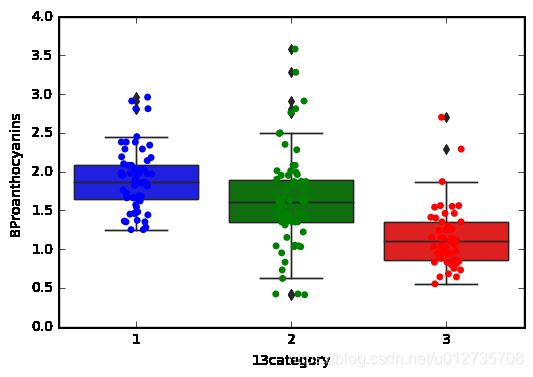
通过对以上每个特征与标签的盒装图和散点图分析,区分度不是很大,不容易进行特征筛选,接下来计算特征和分类的Pearson相关系数
def pearsonar(X,y):
    pearson=[]
    for col in X.columns.values:
        pearson.append(abs(pearsonr(X[col].values,y)[0]))
    pearsonr_X = pd.DataFrame({'col':X.columns,'corr_value':pearson})
    pearsonr_X = pearsonr_X.sort_values(by='corr_value',ascending=False)
    print pearsonr_X
pearsonar(X,y)
结果如下,
       col  corr_value
6                       6Flavanoid    0.847498
11  11OD280/OD315 of diluted wines    0.788230
5                   5Total phenols    0.719163
12                      12Proline     0.633717
10                          10Hue     0.617369
3               3Alcalinity of ash    0.517859
8                8Proanthocyanins     0.499130
7            7Nonflavanoid phenols    0.489109
1                     1Malic acid     0.437776
0                         0Alcohol    0.328222
9                9Color intensity     0.265668
4                       4Magnesium    0.209179
2                             2Ash    0.049643
分析发现只有特征2与标签的线性关系较低 ,再计算特征间的线性相关
c=list(combinations([0, 1, 2, 3, 4, 5, 6, 7, 8, 9,10,11,12],2))
p=[]
for i in range(len(c)):
    p.append(abs(pearsonr(X.iloc[:,c[i][0]],X.iloc[:,c[i][1]])[0]))
pearsonr_ = pd.DataFrame({'col':c,'corr_value':p})
pearsonr_ = pearsonr_.sort_values(by='corr_value',ascending=False)
print pearsonr_
col corr_value 50 (5, 6) 0.864564 61 (6, 11) 0.787194 55 (5, 11) 0.699949 58 (6, 8) 0.652692 11 (0, 12) 0.643720 52 (5, 8) 0.612413 75 (10, 11) 0.565468 20 (1, 10) 0.561296 8 (0, 9) 0.546364 60 (6, 10) 0.543479 57 (6, 7) 0.537900 72 (9, 10) 0.521813 70 (8, 11) 0.519067 66 (7, 11) 0.503270 56 (5, 12) 0.498115 62 (6, 12) 0.494193 51 (5, 7) 0.449935 23 (2, 3) 0.443367 41 (3, 12) 0.440597 54 (5, 10) 0.433681 73 (9, 11) 0.428815 16 (1, 6) 0.411007 49 (4, 12) 0.393351 21 (1, 11) 0.368710 63 (7, 8) 0.365845 36 (3, 7) 0.361922 35 (3, 6) 0.351370 15 (1, 5) 0.335167 71 (8, 12) 0.330417 34 (3, 5) 0.321113 .. ... ... 76 (10, 12) 0.236183 32 (2, 12) 0.223626 18 (1, 8) 0.220746 42 (4, 5) 0.214401 1 (0, 2) 0.211545 46 (4, 9) 0.199950 37 (3, 8) 0.197327 43 (4, 6) 0.195784 22 (1, 12) 0.192011 27 (2, 7) 0.186230 59 (6, 9) 0.172379 12 (1, 2) 0.164045 6 (0, 7) 0.155929 64 (7, 9) 0.139057 7 (0, 8) 0.136698 25 (2, 5) 0.128980 26 (2, 6) 0.115077 0 (0, 1) 0.094397 33 (3, 4) 0.083333 30 (2, 10) 0.074667 10 (0, 11) 0.072343 9 (0, 10) 0.071747 48 (4, 11) 0.066004 47 (4, 10) 0.055398 53 (5, 9) 0.055136 14 (1, 4) 0.054575 68 (8, 9) 0.025250 38 (3, 9) 0.018732 28 (2, 8) 0.009652 31 (2, 11) 0.003911 [78 rows x 2 columns]
5、6、11三个特征相关性较大,可能存在冗余特征
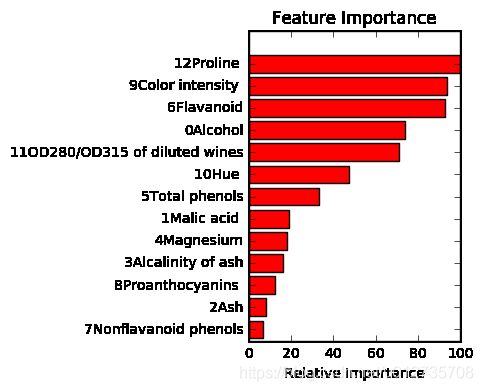
#通过随机森林特征重要性筛选特征
def randomF_importfeat(X,y):
    features_list=X.columns
    forest = RandomForestClassifier(oob_score=True, n_estimators=10000)
    forest.fit(X, y)
    feature_importance = forest.feature_importances_
    feature_importance = 100.0 * (feature_importance / feature_importance.max())
    fi_threshold = 0
    important_idx = np.where(feature_importance > fi_threshold)[0]
    important_features = features_list[important_idx]
    print( "\n", important_features.shape[0], "Important features(>", \
          fi_threshold, "% of max importance)...\n")
    sorted_idx = np.argsort(feature_importance[important_idx])[::-1]
    #get the figure about important features
    pos = np.arange(sorted_idx.shape[0]) + .5
    plt.subplot(1, 2, 2)
    plt.title('Feature Importance')
    plt.barh(pos, feature_importance[important_idx][sorted_idx[::-1]], \
            color='r',align='center')
    plt.yticks(pos, important_features[sorted_idx[::-1]])
    plt.xlabel('Relative Importance')
    plt.draw()
    plt.show()
randomF_importfeat(X,y)
('\n', 13L, 'Important features(>', 0, '% of max importance)...\n')
2这个特征可以考虑删除
先试下PCA降维效果
# 直接PCA降维后枚举各种模型测试
def _PCA(X,y):
    ss=MinMaxScaler()
    X=ss.fit_transform(X)
    pca=PCA(n_components='mle')
    X_new=pca.fit_transform(X)
    clfs = [LogisticRegression(),SGDClassifier(),LinearSVC(),KNeighborsClassifier(),\
            DecisionTreeClassifier(),RandomForestClassifier(),GradientBoostingClassifier(),GaussianNB()]
    for model in clfs:
            print("模型及模型参数:")
            print(str(model))
            print("模型准确率:")
            print(np.mean(cross_val_score(model,X_new,y,cv=10)))
_PCA(X,y)
模型及模型参数:
LogisticRegression(C=1.0, class_weight=None, dual=False, fit_intercept=True,
          intercept_scaling=1, max_iter=100, multi_class='ovr', n_jobs=1,
          penalty='l2', random_state=None, solver='liblinear', tol=0.0001,
          verbose=0, warm_start=False)
模型准确率:
0.983333333333
模型及模型参数:
SGDClassifier(alpha=0.0001, average=False, class_weight=None, epsilon=0.1,
       eta0=0.0, fit_intercept=True, l1_ratio=0.15,
       learning_rate='optimal', loss='hinge', n_iter=5, n_jobs=1,
       penalty='l2', power_t=0.5, random_state=None, shuffle=True,
       verbose=0, warm_start=False)
模型准确率:
0.967251461988
模型及模型参数:
LinearSVC(C=1.0, class_weight=None, dual=True, fit_intercept=True,
     intercept_scaling=1, loss='squared_hinge', max_iter=1000,
     multi_class='ovr', penalty='l2', random_state=None, tol=0.0001,
     verbose=0)
模型准确率:
0.983333333333
模型及模型参数:
KNeighborsClassifier(algorithm='auto', leaf_size=30, metric='minkowski',
           metric_params=None, n_jobs=1, n_neighbors=5, p=2,
           weights='uniform')
模型准确率:
0.971200980392
模型及模型参数:
DecisionTreeClassifier(class_weight=None, criterion='gini', max_depth=None,
            max_features=None, max_leaf_nodes=None,
            min_impurity_split=1e-07, min_samples_leaf=1,
            min_samples_split=2, min_weight_fraction_leaf=0.0,
            presort=False, random_state=None, splitter='best')
模型准确率:
0.927048933609
模型及模型参数:
RandomForestClassifier(bootstrap=True, class_weight=None, criterion='gini',
            max_depth=None, max_features='auto', max_leaf_nodes=None,
            min_impurity_split=1e-07, min_samples_leaf=1,
            min_samples_split=2, min_weight_fraction_leaf=0.0,
            n_estimators=10, n_jobs=1, oob_score=False, random_state=None,
            verbose=0, warm_start=False)
模型准确率:
0.971895424837
模型及模型参数:
GradientBoostingClassifier(criterion='friedman_mse', init=None,
              learning_rate=0.1, loss='deviance', max_depth=3,
              max_features=None, max_leaf_nodes=None,
              min_impurity_split=1e-07, min_samples_leaf=1,
              min_samples_split=2, min_weight_fraction_leaf=0.0,
              n_estimators=100, presort='auto', random_state=None,
              subsample=1.0, verbose=0, warm_start=False)
模型准确率:
0.972222222222
模型及模型参数:
GaussianNB(priors=None)
模型准确率:
0.977743378053
数据很标准,随便PCA一下就能得到如此高分
再试试原始数据在各个默认参数模型上的表现如何,
#划分训练集和测试集
X_train,X_test,y_train,y_test=train_test_split(data.iloc[:,:13],data.iloc[:,13],test_size=0.2,random_state=0)
#此处采用最大最小归一化, 可以换成StandardScaler()归一化方法,如果用StandardScaler()方法的话,则不能使用MultinomialNB()模型
ss=MinMaxScaler()
#ss=StandardScaler()
X_train=ss.fit_transform(X_train)
X_test=ss.transform(X_test)
#模型及模型参数列表
clfs = [LogisticRegression(),SGDClassifier(),LinearSVC(),MultinomialNB(),KNeighborsClassifier(),\
        DecisionTreeClassifier(),RandomForestClassifier(),GradientBoostingClassifier(),GaussianNB(),ExtraTreesClassifier()]
#输出模型及参数信息,以及模型分类准确性
for model in clfs:
        print("模型及模型参数:")
        print(str(model))
        model.fit(X_train,y_train)
        print("模型准确率:")
        print(model.score(X_test,y_test))
模型及模型参数:
LogisticRegression(C=1.0, class_weight=None, dual=False, fit_intercept=True,
intercept_scaling=1, max_iter=100, multi_class='ovr', n_jobs=1,
penalty='l2', random_state=None, solver='liblinear', tol=0.0001,
verbose=0, warm_start=False)
模型准确率:
0.972222222222
模型及模型参数:
SGDClassifier(alpha=0.0001, average=False, class_weight=None, epsilon=0.1,
eta0=0.0, fit_intercept=True, l1_ratio=0.15,
learning_rate='optimal', loss='hinge', n_iter=5, n_jobs=1,
penalty='l2', power_t=0.5, random_state=None, shuffle=True,
verbose=0, warm_start=False)
模型准确率:
1.0
模型及模型参数:
LinearSVC(C=1.0, class_weight=None, dual=True, fit_intercept=True,
intercept_scaling=1, loss='squared_hinge', max_iter=1000,
multi_class='ovr', penalty='l2', random_state=None, tol=0.0001,
verbose=0)
模型准确率:
1.0
模型及模型参数:
MultinomialNB(alpha=1.0, class_prior=None, fit_prior=True)
模型准确率:
0.944444444444
模型及模型参数:
KNeighborsClassifier(algorithm='auto', leaf_size=30, metric='minkowski',
metric_params=None, n_jobs=1, n_neighbors=5, p=2,
weights='uniform')
模型准确率:
0.972222222222
模型及模型参数:
DecisionTreeClassifier(class_weight=None, criterion='gini', max_depth=None,
max_features=None, max_leaf_nodes=None,
min_impurity_split=1e-07, min_samples_leaf=1,
min_samples_split=2, min_weight_fraction_leaf=0.0,
presort=False, random_state=None, splitter='best')
模型准确率:
0.972222222222
模型及模型参数:
RandomForestClassifier(bootstrap=True, class_weight=None, criterion='gini',
max_depth=None, max_features='auto', max_leaf_nodes=None,
min_impurity_split=1e-07, min_samples_leaf=1,
min_samples_split=2, min_weight_fraction_leaf=0.0,
n_estimators=10, n_jobs=1, oob_score=False, random_state=None,
verbose=0, warm_start=False)
模型准确率:
1.0
模型及模型参数:
GradientBoostingClassifier(criterion='friedman_mse', init=None,
learning_rate=0.1, loss='deviance', max_depth=3,
max_features=None, max_leaf_nodes=None,
min_impurity_split=1e-07, min_samples_leaf=1,
min_samples_split=2, min_weight_fraction_leaf=0.0,
n_estimators=100, presort='auto', random_state=None,
subsample=1.0, verbose=0, warm_start=False)
模型准确率:
0.944444444444
模型及模型参数:
GaussianNB(priors=None)
模型准确率:
0.916666666667
模型及模型参数:
ExtraTreesClassifier(bootstrap=False, class_weight=None, criterion='gini',
max_depth=None, max_features='auto', max_leaf_nodes=None,
min_impurity_split=1e-07, min_samples_leaf=1,
min_samples_split=2, min_weight_fraction_leaf=0.0,
n_estimators=10, n_jobs=1, oob_score=False, random_state=None,
verbose=0, warm_start=False)
模型准确率:
0.972222222222
删除第二个特征后,再试一下
params=[ 0,1,3,4,5,6,7,8,9,10,11,12]
X=data.iloc[:,:13]
X=[params]
#划分训练集和测试集
X_train,X_test,y_train,y_test=train_test_split(X,y,test_size=0.2,random_state=0)
#此处采用最大最小归一化, 可以换成StandardScaler()归一化方法,如果用StandardScaler()方法的话,则不能使用MultinomialNB()模型
ss=MinMaxScaler()
#ss=StandardScaler()
X_train=ss.fit_transform(X_train)
X_test=ss.transform(X_test)
#模型及模型参数列表
clfs = [LogisticRegression(),SGDClassifier(),LinearSVC(),MultinomialNB(),KNeighborsClassifier(),\
DecisionTreeClassifier(),RandomForestClassifier(),GradientBoostingClassifier(),GaussianNB(),ExtraTreesClassifier()]
#输出模型及参数信息,以及模型分类准确性
for model in clfs:
print("模型及模型参数:")
print(str(model))
model.fit(X_train,y_train)
print("模型准确率:")
print(model.score(X_test,y_test))模型及模型参数:
LogisticRegression(C=1.0, class_weight=None, dual=False, fit_intercept=True,
intercept_scaling=1, max_iter=100, multi_class='ovr', n_jobs=1,
penalty='l2', random_state=None, solver='liblinear', tol=0.0001,
verbose=0, warm_start=False)
模型准确率:
0.916666666667
模型及模型参数:
SGDClassifier(alpha=0.0001, average=False, class_weight=None, epsilon=0.1,
eta0=0.0, fit_intercept=True, l1_ratio=0.15,
learning_rate='optimal', loss='hinge', n_iter=5, n_jobs=1,
penalty='l2', power_t=0.5, random_state=None, shuffle=True,
verbose=0, warm_start=False)
模型准确率:
0.944444444444
模型及模型参数:
LinearSVC(C=1.0, class_weight=None, dual=True, fit_intercept=True,
intercept_scaling=1, loss='squared_hinge', max_iter=1000,
multi_class='ovr', penalty='l2', random_state=None, tol=0.0001,
verbose=0)
模型准确率:
1.0
模型及模型参数:
MultinomialNB(alpha=1.0, class_prior=None, fit_prior=True)
模型准确率:
0.944444444444
模型及模型参数:
KNeighborsClassifier(algorithm='auto', leaf_size=30, metric='minkowski',
metric_params=None, n_jobs=1, n_neighbors=5, p=2,
weights='uniform')
模型准确率:
0.944444444444
模型及模型参数:
DecisionTreeClassifier(class_weight=None, criterion='gini', max_depth=None,
max_features=None, max_leaf_nodes=None,
min_impurity_split=1e-07, min_samples_leaf=1,
min_samples_split=2, min_weight_fraction_leaf=0.0,
presort=False, random_state=None, splitter='best')
模型准确率:
0.972222222222
模型及模型参数:
RandomForestClassifier(bootstrap=True, class_weight=None, criterion='gini',
max_depth=None, max_features='auto', max_leaf_nodes=None,
min_impurity_split=1e-07, min_samples_leaf=1,
min_samples_split=2, min_weight_fraction_leaf=0.0,
n_estimators=10, n_jobs=1, oob_score=False, random_state=None,
verbose=0, warm_start=False)
模型准确率:
0.972222222222
模型及模型参数:
GradientBoostingClassifier(criterion='friedman_mse', init=None,
learning_rate=0.1, loss='deviance', max_depth=3,
max_features=None, max_leaf_nodes=None,
min_impurity_split=1e-07, min_samples_leaf=1,
min_samples_split=2, min_weight_fraction_leaf=0.0,
n_estimators=100, presort='auto', random_state=None,
subsample=1.0, verbose=0, warm_start=False)
模型准确率:
0.944444444444
模型及模型参数:
GaussianNB(priors=None)
模型准确率:
0.916666666667
模型及模型参数:
ExtraTreesClassifier(bootstrap=False, class_weight=None, criterion='gini',
max_depth=None, max_features='auto', max_leaf_nodes=None,
min_impurity_split=1e-07, min_samples_leaf=1,
min_samples_split=2, min_weight_fraction_leaf=0.0,
n_estimators=10, n_jobs=1, oob_score=False, random_state=None,
verbose=0, warm_start=False)
模型准确率:
1.0
对于数据集较小的,试验了一下贪婪搜索了所有特征组合可能
def greed(X,y):
    ss=MinMaxScaler()
    X=ss.fit_transform(X)
    X=pd.DataFrame(X)
    jilu=pd.DataFrame(columns=['m','feature','score'])
    params=[0, 1, 2, 3, 4, 5, 6, 7, 8, 9,10,11,12]
    model = LinearSVC()
    best_socre=0
    n=13
    i=1
    index=0
    while i<=n:
        test_params=list(combinations(params, i))
        j=int(comb(n,i))
        i=i+1
        for m in range(j):
            z=list(test_params[m])
            score = np.mean(cross_val_score(model,X[z],y,cv=10))    #10折交叉验证取平均
            if score>best_socre:
                best_socre=score
                best_feature=z
            jilu.loc[index,['m']]=m
            jilu.loc[index,['feature']]=str(z)
            jilu.loc[index,['score']]=score
            index=index+1
    print(jilu)
    print ("best_feature=",best_feature,"best_score=",best_socre)
greed(data.iloc[:,:13],data.iloc[:,13])

