Matlab(四)
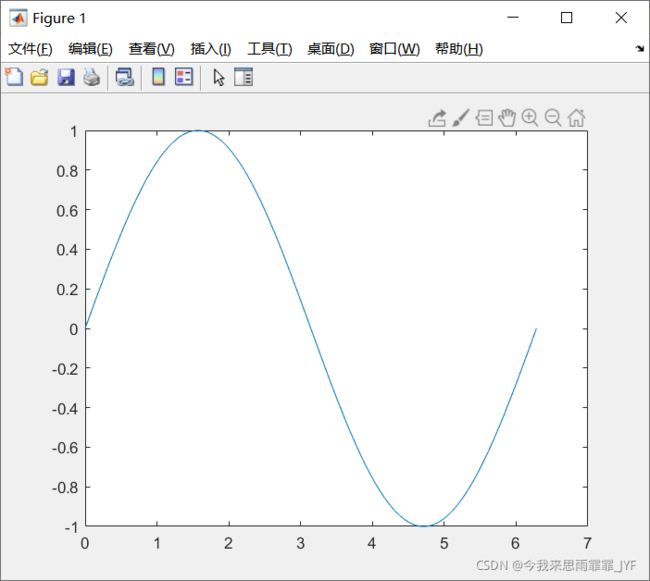
>> x=0:0.005*pi:2*pi;
y=sin(x);
plot(x,y)
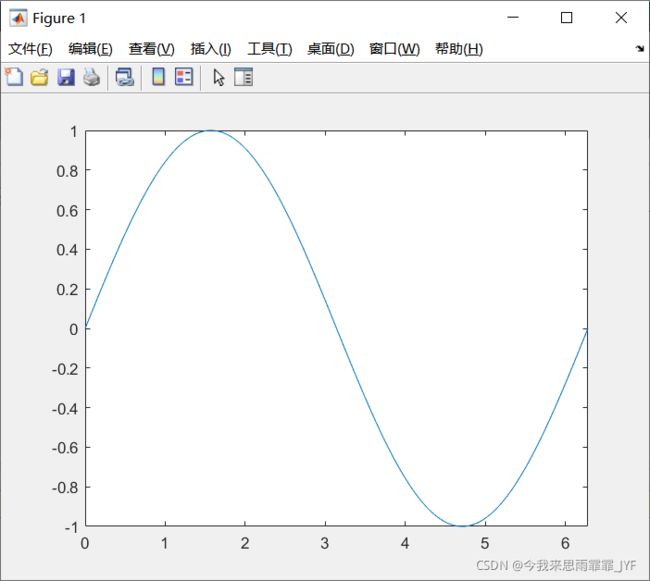
>>  x=0:0.005*pi:2*pi;
y=sin(x);
plot(x,y)
xlim([0,2*pi])
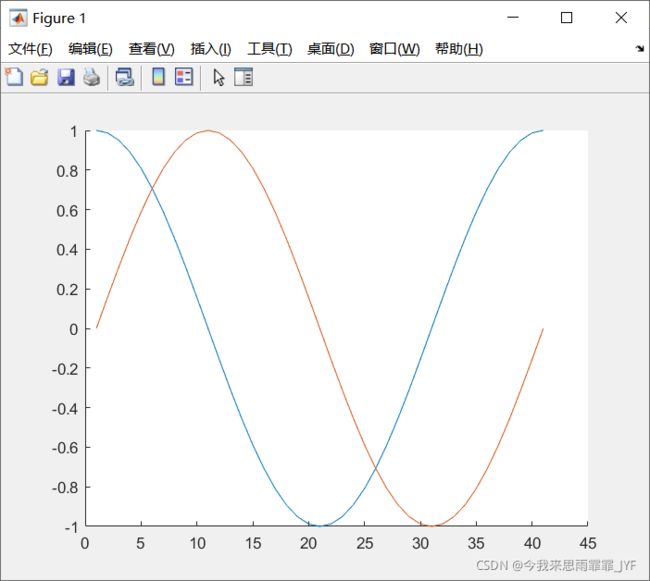
plot(sin(0:pi/20:2*pi));
>> hold on
plot(cos(0:pi/20:2*pi));
plot(sin(0:pi/20:2*pi));
hold off
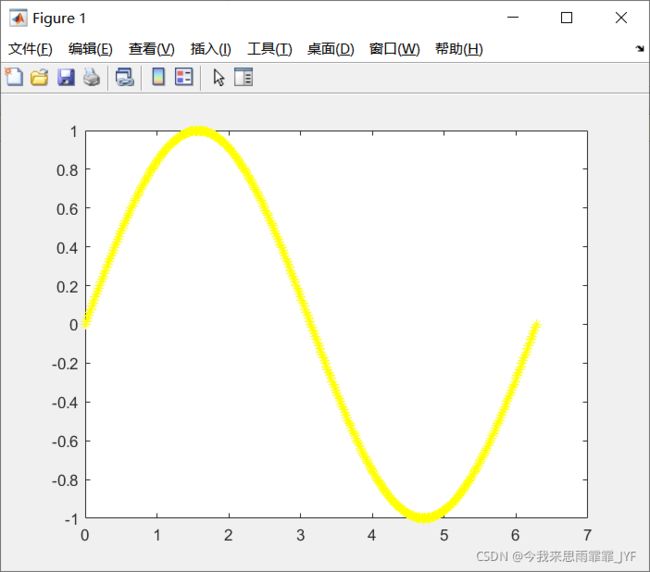
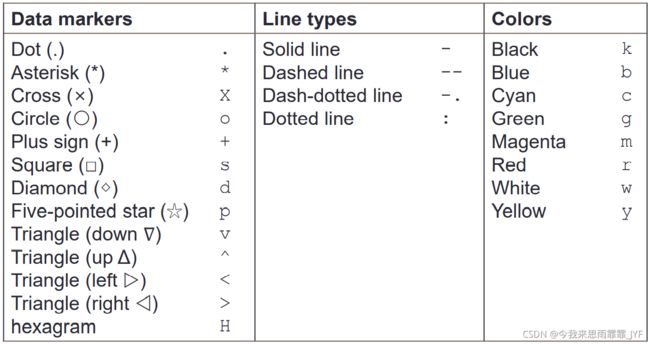
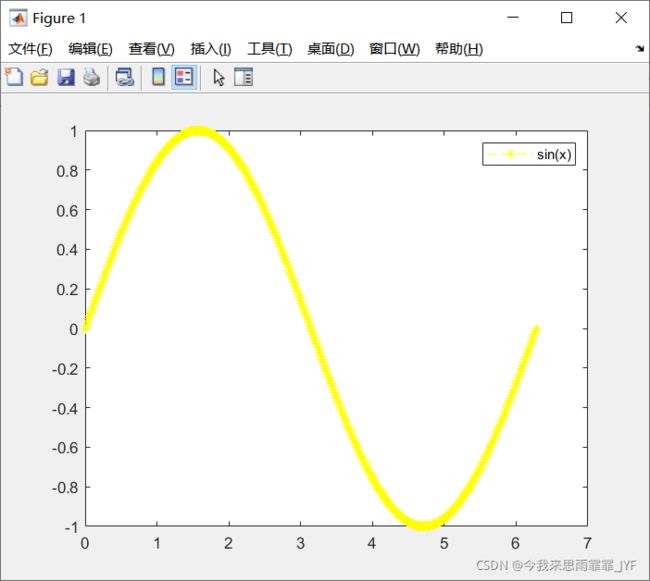
>> plot(x,y,'*y--') %plot(x,y,'符号颜色连线')
>> legend('sin(x)')
• title()
• xlabel()
• ylabel()
• zlabel()
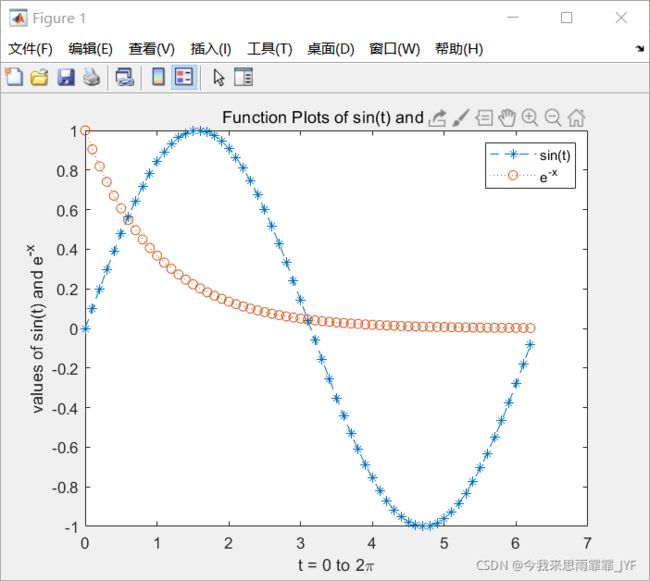
x = 0:0.1:2*pi; y1 = sin(x); y2 = exp(-x);
plot(x, y1, '--*', x, y2, ':o');
xlabel('t = 0 to 2\pi');
ylabel('values of sin(t) and e^{-x}')
title('Function Plots of sin(t) and e^{-x}');
legend('sin(t)','e^{-x}');
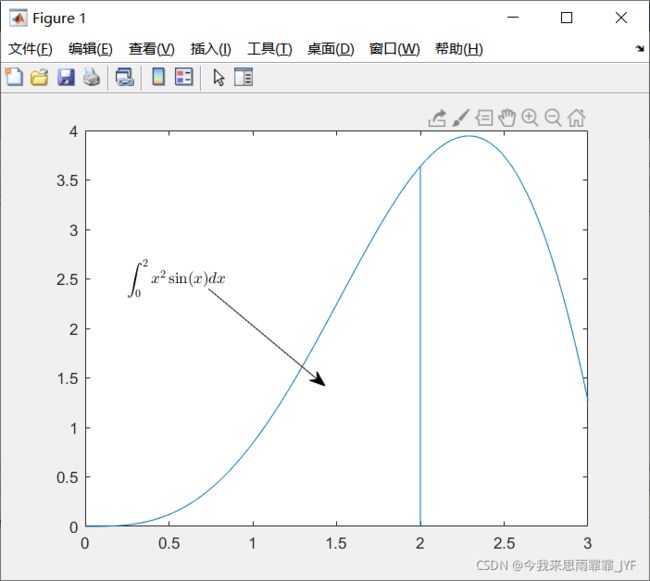
x = linspace(0,3); y = x.^2.*sin(x); plot(x,y);
line([2,2],[0,2^2*sin(2)]);
str = '$$ \int_{0}^{2} x^2\sin(x) dx $$';
text(0.25,2.5,str,'Interpreter','latex');
annotation('arrow','X',[0.32,0.5],'Y',[0.6,0.4]);
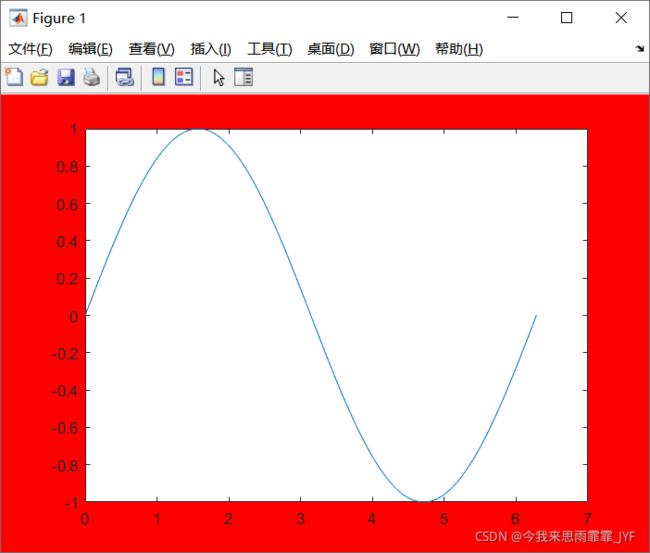
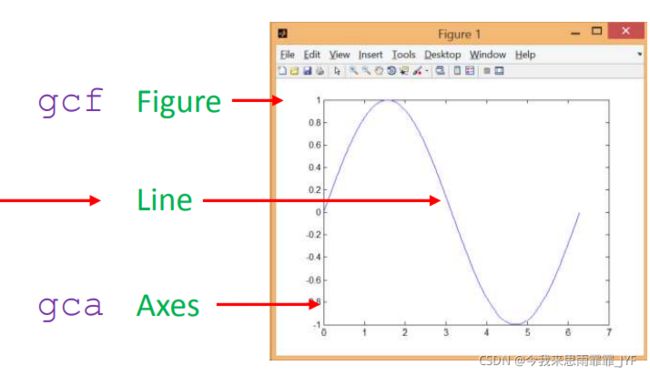
>> x = linspace(0, 2*pi, 1000); y = sin(x);
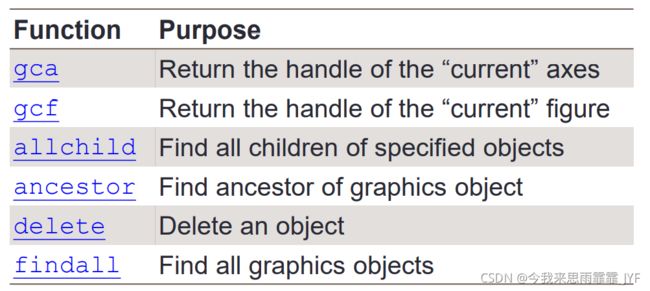
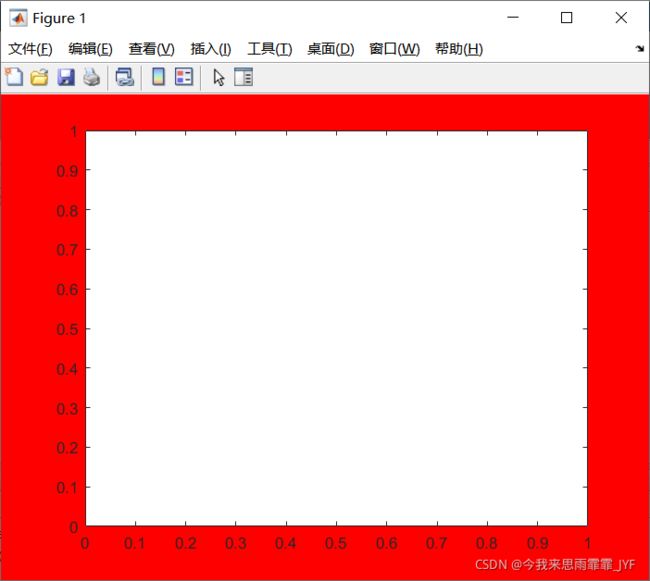
plot(x,y); set(gcf, 'Color', [1 0 0]);
>> x = linspace(0, 2*pi, 1000); y = sin(x);
>> h=plot(x,y); set(gcf, 'Color', [1 0 0]);
>> delete(h)
>> x = linspace(0, 2*pi, 1000); y = sin(x);
h=plot(x,y); set(gcf, 'Color', [1 0 0]);
>> get(h)
    AlignVertexCenters: 'off'
            Annotation: [1×1 matlab.graphics.eventdata.Annotation]
          BeingDeleted: 'off'
            BusyAction: 'queue'
         ButtonDownFcn: ''
              Children: [0×0 GraphicsPlaceholder]
              Clipping: 'on'
                 Color: [0 0.4470 0.7410]
             CreateFcn: ''
       DataTipTemplate: [1×1 matlab.graphics.datatip.DataTipTemplate]
             DeleteFcn: ''
           DisplayName: ''
      HandleVisibility: 'on'
               HitTest: 'on'
         Interruptible: 'on'
              LineJoin: 'round'
             LineStyle: '-'
             LineWidth: 0.5000
                Marker: 'none'
       MarkerEdgeColor: 'auto'
       MarkerFaceColor: 'none'
         MarkerIndices: [1×1000 uint64]
            MarkerSize: 6
                Parent: [1×1 Axes]
         PickableParts: 'visible'
              Selected: 'off'
    SelectionHighlight: 'on'
                   Tag: ''
                  Type: 'line'
         UIContextMenu: [0×0 GraphicsPlaceholder]
              UserData: []
               Visible: 'on'
                 XData: [1×1000 double]
             XDataMode: 'manual'
           XDataSource: ''
                 YData: [1×1000 double]
           YDataSource: ''
                 ZData: [1×0 double]
           ZDataSource: ''
>> x = linspace(0, 2*pi, 1000); y = sin(x);
>> h=plot(x,y); set(gcf, 'Color', [1 1 1]);
>
>> set(gca,'XLim', [0, 2*pi]);
>> set(gca,'YLim', [-1.2, 1.2]);
>或
>xlim([0, 2*pi]);
ylim([-1.2, 1.2]);
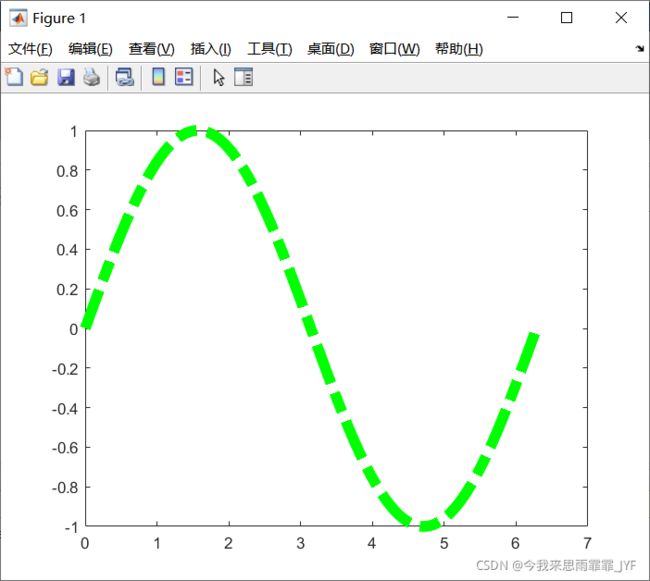
>> x = linspace(0, 2*pi, 1000); y = sin(x);
>> h=plot(x,y); set(gcf, 'Color', [1 1 1]);
>> set(h, 'LineStyle','-.','LineWidth', 7.0, 'Color', 'g');
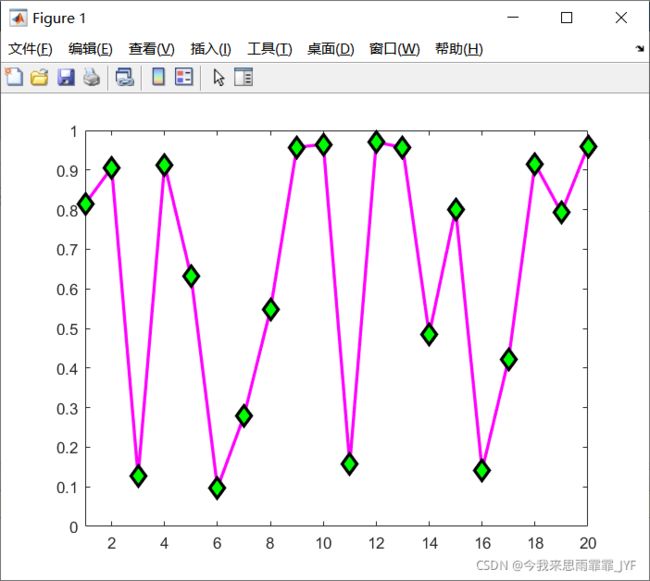
>> x=rand(20,1); set(gca, 'FontSize', 18);
>> plot(x,'-md','LineWidth', 2, 'MarkerEdgeColor', 'k',...
'MarkerFaceColor', 'g', 'MarkerSize', 10);
>> xlim([1, 20]);
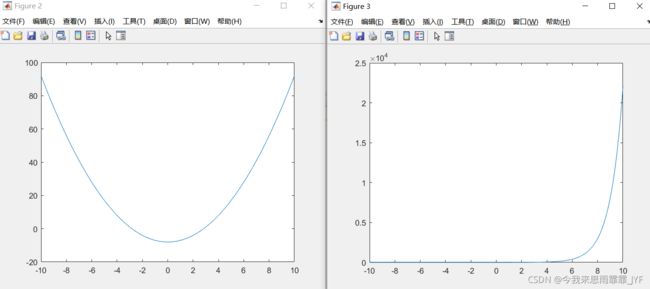
>> x = -10:0.1:10;
y1 = x.^2 - 8;
y2 = exp(x);
figure, plot(x,y1);
figure, plot(x,y2);
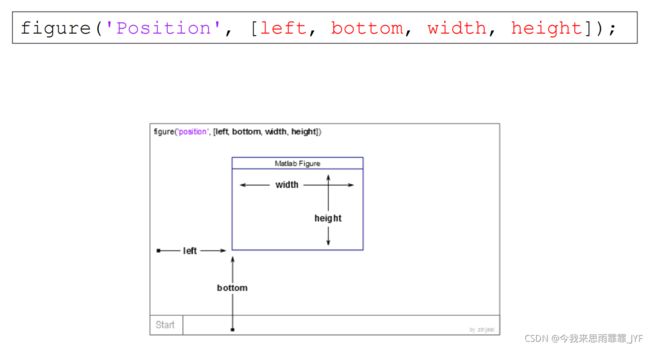
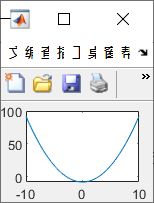
>> figure('Position',[100,100,80,80]),plot(x,y1)
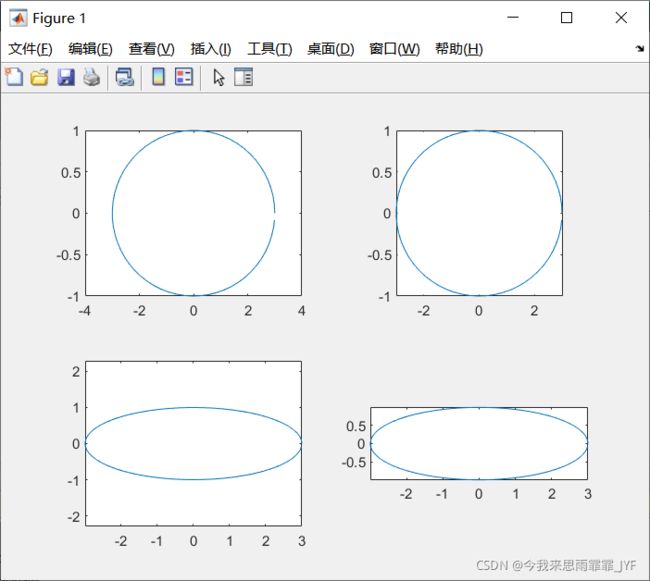
>> t = 0:0.1:2*pi; x = 3*cos(t); y = sin(t);
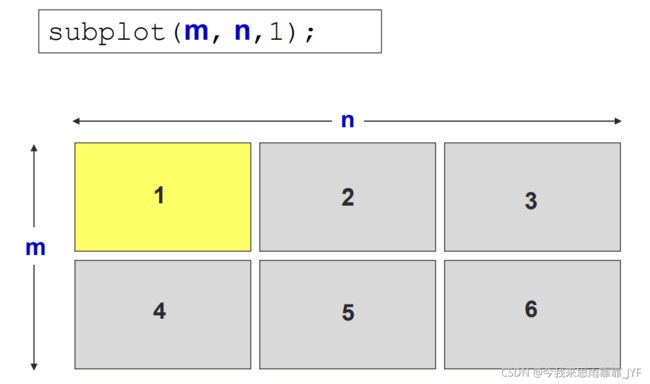
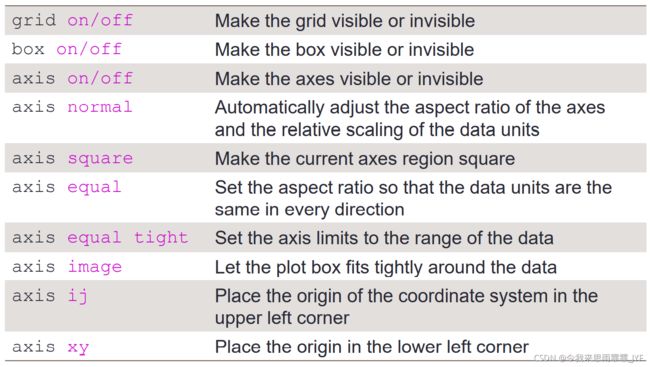
subplot(2, 2, 1); plot(x, y); axis normal
subplot(2, 2, 2); plot(x, y); axis square
subplot(2, 2, 3); plot(x, y); axis equal
subplot(2, 2, 4); plot(x, y); axis equal tight
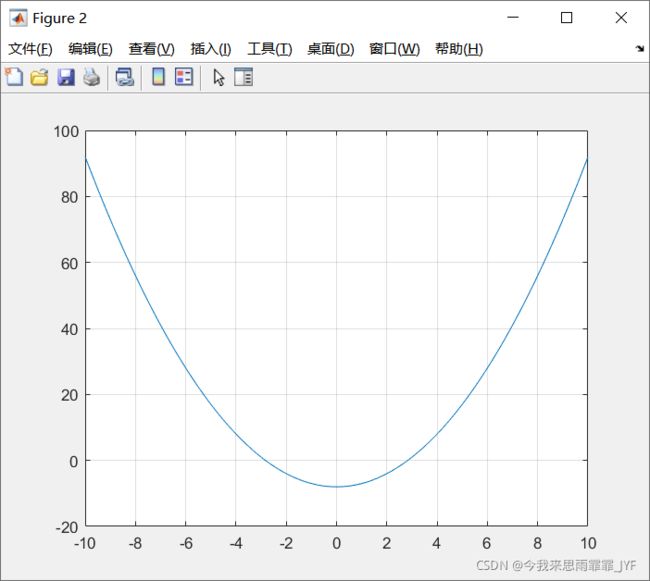
>> x = -10:0.1:10;
>> y1 = x.^2 - 8;
>> figure, plot(x,y1);
>> grid on
