【数据挖掘】金融风控 Task01 赛题理解
【数据挖掘】金融风控 Task01 赛题理解
- 1.赛题介绍
-
- 1.1赛题概况
- 1.2 数据概况
- 1.3 预测指标
-
- 1.3.1 混淆矩阵
- 1.3.2 准确率、精确率、召回率、F1 Score
- 1.3.3 P-R曲线
- 1.3.4 ROC曲线
- 1.3.5 AUC面积
- 1.3.6 金融风控常见评估指标
- 1.4 赛题流程
- 1.5 评分卡
- =====================================
- 课程一总结 赛题理解&基线(baseline)方案
-
- 1.金融风控相关知识
- 2.竞赛中主要模块
-
- 2.1 问题建模
- 2.2 数据探索性分析(EDA)
- 3.赛题理解部分
- 4.基线方案(baseline)
学习地址:https: //github.com/datawhalechina/team-learning-data-mining/tree/master/FinancialRiskControl
天池竞赛地址:https://tianchi.aliyun.com/competition/entrance/531830/introduction
1.赛题介绍
1.1赛题概况
比赛要求参赛选手根据给定的数据集,建立模型,预测金融风险。
赛题以预测金融风险为任务,数据集来自某信贷平台的贷款记录,总数据量超过120w,包含47列变量信息,其中15列为匿名变量。为了保证比赛的公平性,将会从中抽取80万条作为训练集,20万条作为测试集A,20万条作为测试集B,同时会对employmentTitle、purpose、postCode和title等信息进行脱敏。
1.2 数据概况
包含47列变量信息,其中15列为匿名变量,通过info()查看数据类型及缺失情况
| 变量 | 含义 | 数据量及类型 | 备注 |
|---|---|---|---|
| id | 为贷款清单分配的唯一信用证标识 | 800000 non-null int64 | |
| loanAmnt | 贷款金额 | 800000 non-null float64 | |
| term | 贷款期限(year) | 800000 non-null int64 | |
| interestRate | 贷款利率 | 800000 non-null float64 | |
| installment | 分期付款金额 | 800000 non-null float64 | |
| grade | 贷款等级 | 800000 non-null object | 用A、B、C、D、E、F、G表示的 |
| subGrade | 贷款等级之子级 | 800000 non-null object | 每类有五个子类用如A1、A2…A5表示 |
| employmentTitle | 就业职称 | 799999 non-null float64 | 用数字表示 |
| employmentLength | 就业年限(年) | 753201 non-null object |
2 year |
| homeOwnership | 借款人在登记时提供的房屋所有权状况 | 800000 non-null int64 | 有0、1、2、3、4、5六种 |
| annualIncome | 年收入 | 800000 non-null float64 | |
| verificationStatus | 验证状态 | 800000 non-null int64 | 有0、1、2三种 |
| issueDate | 贷款发放的月份 | 800000 non-null object | 2014-07-01形式 |
| isDefault | 是否违约 | 0或者1 | |
| purpose | 借款人在贷款申请时的贷款用途类别 | 800000 non-null int64 | 0~13 |
| postCode | 借款人在贷款申请中提供的邮政编码的前3位数字 | 799999 non-null float64 | |
| regionCode | 地区编码 | 800000 non-null int64 | |
| dti | 债务收入比 | 799761 non-null float64 |
|
| delinquency_2years | 借款人过去2年信用档案中逾期30天以上的违约事件数 | 800000 non-null float64 | |
| ficoRangeLow | 借款人在贷款发放时的fico所属的下限范围 | 800000 non-null float64 | |
| ficoRangeHigh | 借款人在贷款发放时的fico所属的上限范围 | 800000 non-null float64 | |
| openAcc | 借款人信用档案中未结信用额度的数量 | 800000 non-null float64 | |
| pubRec | 贬损公共记录的数量 | 800000 non-null float64 | |
| pubRecBankruptcies | 公开记录清除的数量 | 799595 non-null float64 |
|
| revolBal | 信贷周转余额合计 | 800000 non-null float64 | |
| revolUtil | 循环额度利用率,或借款人使用的相对于所有可用循环信贷的信贷金额 | 799469 non-null float64 | |
| totalAcc | 借款人信用档案中当前的信用额度总数 | 800000 non-null float64 | |
| initialListStatus | 贷款的初始列表状态 | 800000 non-null int64 | 0或者1 |
| applicationType | 表明贷款是个人申请还是与两个共同借款人的联合申请 | 800000 non-null int64 | |
| earliesCreditLine | 借款人最早报告的信用额度开立的月份 | 800000 non-null object | Aug-2001 |
| title | 借款人提供的贷款名称 | 799999 non-null float64 | 0或1 |
| policyCode | 公开可用的策略_代码=1新产品不公开可用的策略_代码=2 | 800000 non-null float64 | |
| n0 | 759730 non-null float64 |
||
| n1 | 759730 non-null float64 |
||
| n2 | 759730 non-null float64 |
||
| n2.1 | 759730 non-null float64 |
||
| n4 | 766761 non-null float64 |
||
| n5 | 759730 non-null float64 |
||
| n6 | 759730 non-null float64 |
||
| n7 | 759730 non-null float64 |
||
| n8 | 759729 non-null float64 |
||
| n9 | 759730 non-null float64 |
||
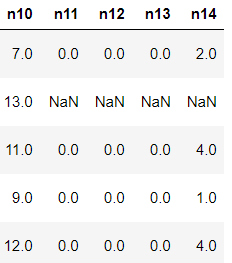
| n10 | 766761 non-null float64 |
||
| n11 | 730248 non-null float64 |
||
| n12 | 759730 non-null float64 |
||
| n13 | 759730 non-null float64 |
||
| n14 | 759730 non-null float64 |
1.3 预测指标
采用AUC作为评价指标,AUC(Area Under Curve)被定义为 ROC曲线 下与坐标轴围成的面积。
1.3.1 混淆矩阵
(1)若一个实例是正类,并且被预测为正类,即为真正类TP(True Positive )
(2)若一个实例是正类,但是被预测为负类,即为假负类FN(False Negative )
(3)若一个实例是负类,但是被预测为正类,即为假正类FP(False Positive )
(4)若一个实例是负类,并且被预测为负类,即为真负类TN(True Negative )
使用方法:
from sklearn.metrics import confusion_matrix#混淆矩阵
sklearn.metrics.confusion_matrix(y_true, y_pred, labels=None, sample_weight=None)
#y_true:是样本真实分类结果
#y_pred 是样本预测分类结果
#labels是所给出的类别,通过这个可对类别进行选择 #sample_weight 是样本权重
例子
#导入相关包
import numpy as np
from sklearn.metrics import confusion_matrix#混淆矩阵
y_pred=[0,1,0,1] #预测值
y_true=[0,1,1,0] #真实值
#混淆矩阵
#真正1 真负1 假正1 假负1
print('混淆矩阵为:\n',confusion_matrix(y_true,y_pred))
1.3.2 准确率、精确率、召回率、F1 Score
(1)准确率(Accuracy) 准确率是常用的一个评价指标,但是不适合样本不均衡的情况,即所有预测准确的/总预测样本数。 A c c u r a c y = T P + T N T P + T N + F P + F N Accuracy = \frac{TP + TN}{TP + TN + FP + FN} Accuracy=TP+TN+FP+FNTP+TN
(2)精确率(Precision) 又称查准率,正确预测为正样本(TP)占预测为正样本(TP+FP)的百分比。 P r e c i s i o n = T P T P + F P Precision = \frac{TP}{TP + FP} Precision=TP+FPTP
(3)召回率(Recall) 又称为查全率,正确预测为正样本(TP)占正样本(TP+FN)的百分比。 R e c a l l = T P T P + F N Recall = \frac{TP}{TP + FN} Recall=TP+FNTP
(4)F1 Score 精确率和召回率是相互影响的,精确率升高则召回率下降,召回率升高则精确率下降,如果需要兼顾二者,就需要精确率、召回率的结合F1 Score。 F 1 − S c o r e = 2 1 P r e c i s i o n + 1 R e c a l l F1-Score = \frac{2}{\frac{1}{Precision} + \frac{1}{Recall}} F1−Score=Precision1+Recall12
使用方法
#计算准确率精确率召回率和F1分数
from sklearn import  metrics
y_pred=[0,1,0,1] #预测值
y_true=[0,1,1,0] #真实值
#准确率=预测准确的/所有预测
print('准确率为:',metrics.accuracy_score(y_true,y_pred))
#精确率=真正确的/所有预测正确的=0.5
print('精确率为:',metrics.precision_score(y_true,y_pred))
#召回率=真正确的/正样本数=0.5
print('召回率为:',metrics.recall_score(y_true,y_pred))
#F1分数=2/4=0.5
print('F1分数为:',metrics.f1_score(y_true,y_pred))

也可以使用sklearn中的classification_report函数用于显示主要分类指标的文本报告.在报告中显示每个类的精确度,召回率,F1值等信息。
使用方法
sklearn.metrics.classification_report(y_true, y_pred, labels=None, target_names=None, sample_weight=None, digits=2, output_dict=False)
| 参数 | 作用 |
|---|---|
| y_true | 1 维数组,真实数据的分类标签 |
| y_pred | 1 维数组,模型预测的分类标签 |
| labels | 列表,需要评估的标签名称 |
| target_names | 列表,指定标签名称 |
| sample_weight | 1 维数组,不同数据点在评估结果中所占的权重 |
| digits | 评估报告中小数点的保留位数,如果 output_dict=True,此参数不起作用,返回的数值不作处理 |
| output_dict | 若真,评估结果以字典形式返回返回字符串或者字典 |
例子
#精确率、召回率以及f-分数可使用classification_report模块
from sklearn.metrics import classification_report
# 精确率、召回率以及f1-score
print(classification_report(y_train,pred))
![]()
1.3.3 P-R曲线
P-R曲线(Precision-Recall Curve) P-R曲线是描述精确率和召回率变化的曲线,横坐标为召回率,纵坐标为精确率

#P-R曲线
import matplotlib.pyplot as plt
%matplotlib inline
#PR曲线横坐标为召回率,纵坐标为精确率
from sklearn.metrics import precision_recall_curve
y_pred = [0, 1, 1, 0, 1, 1, 0, 1, 1, 1]
y_true = [0, 1, 1, 0, 1, 0, 1, 1, 0, 1]
precision,recall,thresholds=precision_recall_curve(y_true,y_pred)
plt.plot(recall,precision)
plt.ylabel('precision')
plt.xlabel('recall')
1.3.4 ROC曲线
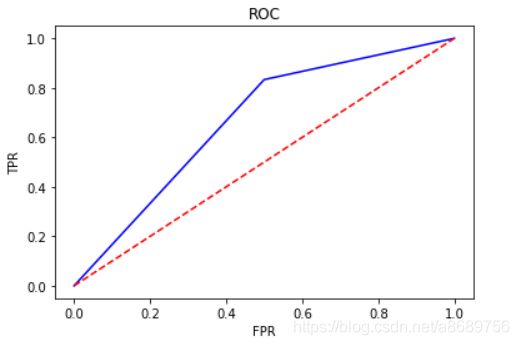
ROC空间将假正例率(FPR)定义为 X 轴,真正例率(TPR)定义为 Y 轴。
TPR:在所有实际为正例的样本中,被正确地判断为正例之比率(也就是召回率) T P R = T P T P + F N TPR = \frac{TP}{TP + FN} TPR=TP+FNTP FPR:在所有实际为负例的样本中,被错误地判断为正例之比率。 F P R = F P F P + T N FPR = \frac{FP}{FP + TN} FPR=FP+TNFP
-
横轴FPR:1-TNR,1-Specificity,FPR越大,预测正类中实际负类越多。
-
纵轴TPR:Sensitivity(正类覆盖率),TPR越大,预测正类中实际正类越多。

使用方法
在sklearn中sklearn.metrics.roc_curve()函数用于绘制ROC曲线,使用前需要调用from sklearn.metrics import roc_curve模块
| 参数 | 作用 |
|---|---|
| y_true | 真实的样本标签,默认为{0,1}或者{-1,1}。如果要设置为其它值,则 pos_label 参数要设置为特定值。例如要令样本标签为{1,2},其中2表示正样本,则pos_label=2。 |
| y_score | 对每个样本的预测结果。 |
| pos_label | 正样本的标签。 |
roc_curve() 函数有3个返回值,即假阳率FPR、真阳率TPR、阈值thresholds,阈值thresholds为将预测结果scores从大到小排列的结果。这里的thresholds指的是大于等于这个阈值为正类,负责为负类。所以通过改变不同的阈值,预测结果也将发生变化
例子
##ROC曲线,横坐标FPR,纵坐标TPR
from sklearn.metrics import roc_curve
y_pred = [0, 1, 1, 0, 1, 1, 0, 1, 1, 1]
y_true = [0, 1, 1, 0, 1, 0, 1, 1, 0, 1]
FPR,TPR,thresholds=roc_curve(y_true,y_pred)
plt.title('ROC')
plt.plot(FPR,TPR,'b')
plt.plot([0,1],[0,1],'r--')
plt.ylabel('TPR')
plt.xlabel('FPR')
1.3.5 AUC面积
AUC(Area Under Curve) AUC(Area Under Curve)被定义为 ROC曲线 下与坐标轴围成的面积。
显然这个面积的数值不会大于1。又由于ROC曲线一般都处于y=x这条直线的上方,所以AUC的取值范围在0.5和1之间。AUC越接近1.0,检测方法真实性越高;等于0.5时,则真实性最低,无应用价值。
#计算AUC面积
import numpy as np
from sklearn.metrics import roc_auc_score
y_true = np.array([0, 0, 1, 1])
y_scores = np.array([0.1, 0.4, 0.35, 0.8])
print('AUC值为:',roc_auc_score(y_true,y_scores))
![]()
1.3.6 金融风控常见评估指标
KS(Kolmogorov-Smirnov) K-S曲线与ROC曲线类似,不同在于
- ROC曲线将真正例率和假正例率作为横纵轴
- K-S曲线将真正例率和假正例率都作为纵轴,横轴则由选定的阈值来充当。 公式如下: K S = m a x ( T P R − F P R ) KS=max(TPR-FPR) KS=max(TPR−FPR) KS不同代表的不同情况,
一般情况KS值越大,模型的区分能力越强,但是也不是越大模型效果就越好,如果KS过大,模型可能存在异常,所以当KS值过高可能需要检查模型是否过拟合。以下为KS值对应的模型情况,但此对应不是唯一的,只代表大致趋势。 - KS值<0.2,一般认为模型没有区分能力。
- KS值[0.2,0.3],模型具有一定区分能力,勉强可以接受
- KS值[0.3,0.5],模型具有较强的区分能力。
- KS值大于0.75,往往表示模型有异常。
#KS值 在实际操作时往往使用ROC曲线配合求出KS值
from sklearn.metrics import roc_curve
y_pred = [0, 1, 1, 0, 1, 1, 0, 1, 1, 1]
y_true = [0, 1, 1, 0, 1, 0, 1, 1, 1, 1]
FPR,TPR,thresholds=roc_curve(y_true, y_pred)
print(FPR)
print(TPR)
print(thresholds)
KS=abs(FPR-TPR).max()
print('KS值:',KS)
1.4 赛题流程
1.5 评分卡
什么是评分卡(信贷场景中)
- 以分数的形式来衡量风险几率的一种手段
- 对未来一段时间内违约/逾期/失联概率的预测
- 通常评分越高越安全
- 根据使用场景分为反欺诈评分卡、申请评分卡、行为评分卡、催收评分卡
评分卡开发的常用模型
- 逻辑回归
- 决策树
构建风控评分卡模型介绍(WOE/KS/ROC)
#评分卡 不是标准评分卡
def Score(prob,P0=600,PDO=20,badrate=None,goodrate=None):
    P0 = P0
    PDO = PDO
    theta0 = badrate/goodrate
    B = PDO/np.log(2)
    A = P0 + B*np.log(2*theta0)
    score = A-B*np.log(prob/(1-prob))
    return score
=====================================
课程一总结 赛题理解&基线(baseline)方案
1.金融风控相关知识
在贷款前会去填写一些信息数据,并且还有一定的历史数据,贷款违约便是根据这些进行预测,计算分数,决定是否进行借贷或投资最小化相关风险

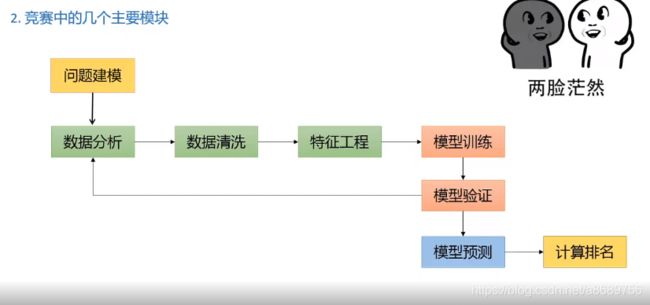
2.竞赛中主要模块
2.1 问题建模
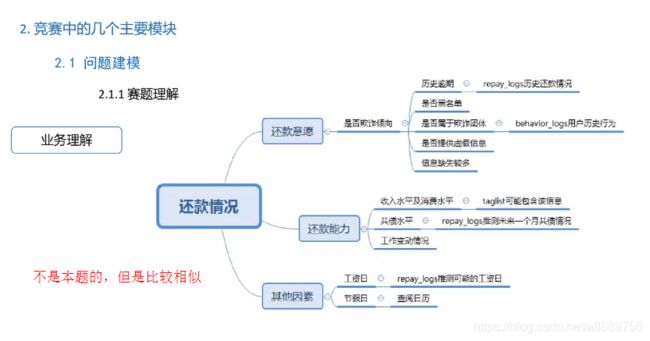
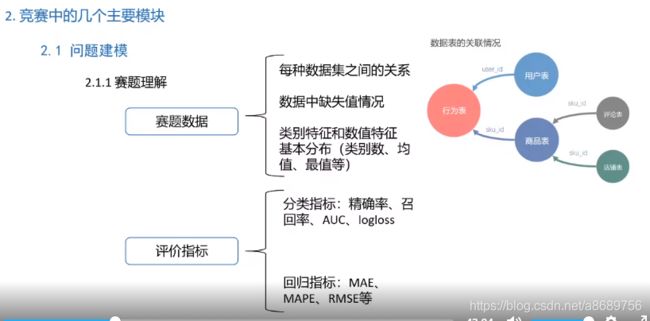
考虑是否存在实现序列,比如天气。此时可以使用时序验证

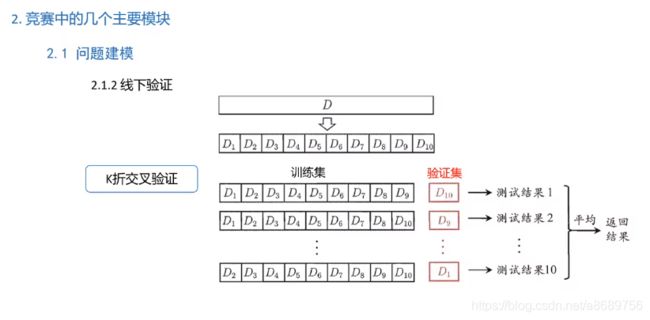
使用k折交叉验证可以使得数据更稳定些,结果更稳定些,提高泛化性
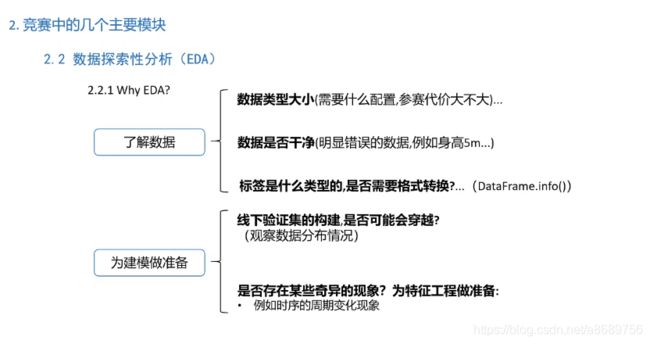
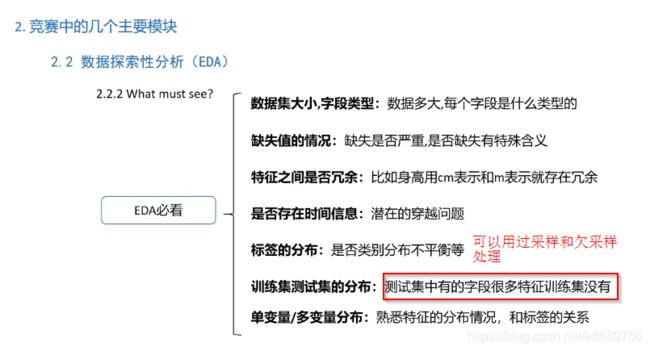
2.2 数据探索性分析(EDA)
3.赛题理解部分
两个测试集替换,避免造成过拟合

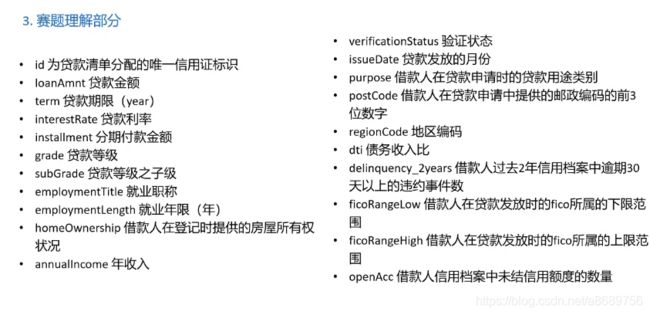
查看n列先进行区分(查看哪些是正向的,哪些是负向的,避免正负相抵消)之后再做融合

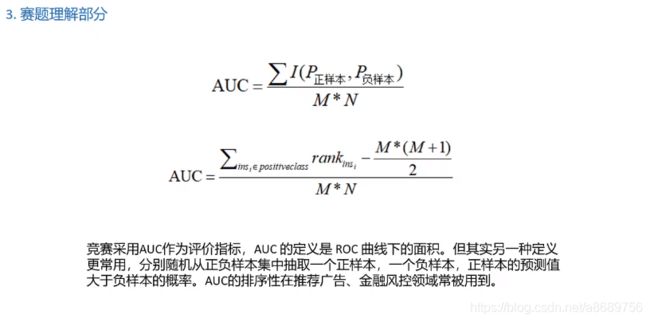
更重要的是一个排序作用即正样本的值大于负样本的概率
4.基线方案(baseline)
类别特征中对于高维的使用rank进行转换,使用rank更具有鲁棒性
特征提取是提分的一个很好的提分项
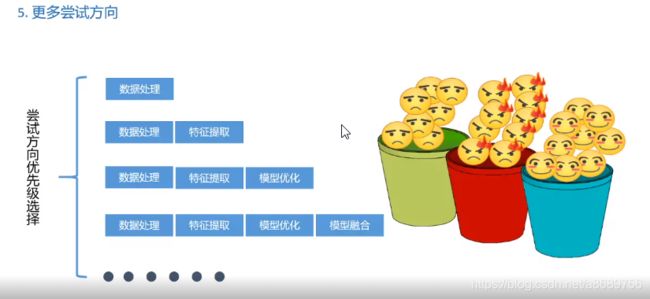
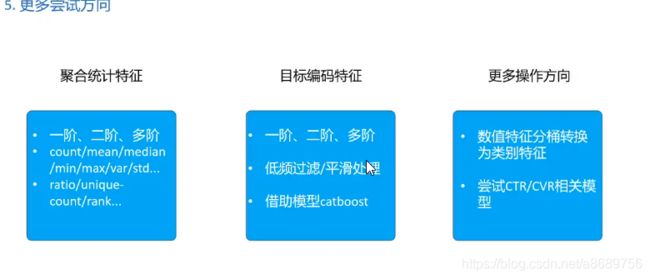
原来的数据中职称的类别太多了,某类别可能只出现了一次其又恰好没有违约,以这个结果来判断这个职位的都不会违约是不合适的,对于这种情况可以考虑平滑处理或者用catboost来对数值特征目标特征进行编码
