基于人工大猩猩部队优化算法的函数寻优算法
文章目录
- 一、理论基础
-
- 1、人工大猩猩部队优化算法(GTO)
-
- 1.1 探索阶段
- 1.2 开发阶段
-
- 1.2.1 跟随银背大猩猩
- 1.2.2 竞争成年雌性
- 2、GTO算法伪代码
- 二、仿真实验与分析
-
- 1、函数测试与数值分析
- 2、GTO优化WSN覆盖
-
- 2.1 节点覆盖模型
- 2.2 实验分析
- 三、参考文献
一、理论基础
本文从大猩猩部队的社会智能出发,提出了一种新的元启发式算法,称为人工大猩猩部队优化算法(Artificial Gorilla Troops Optimizer, GTO)。在这个算法中,大猩猩的群体生活被数学化,新的机制被设计用来进行探索和开发。
1、人工大猩猩部队优化算法(GTO)
1.1 探索阶段
该阶段的数学模型如下所示: G X ( t + 1 ) = { ( U B − L B ) × r 1 + L B , r a n d < p ( r 2 − C ) × X r ( t ) + L × H , r a n d ≥ 0.5 X ( i ) − L × ( L × ( X ( t ) − G X r ( t ) ) ) + r 3 × ( X ( t ) − G X r ( t ) ) , r a n d < 0.5 (1) GX(t+1)=\begin{dcases}(UB-LB)×r_1+LB,\quad\quad\quad\quad\quad\quad\quad\quad\quad\quad\quad\quad\quad\quad\quad\quad\,\,\, rand
此外,在式(1)中, H H H利用式(5)进行计算, Z Z Z使用式(6)进行计算,并且 Z Z Z是问题维度中范围为 [ − C , C ] [-C,C] [−C,C]的随机值。 H = Z × X ( t ) (5) H=Z×X(t)\tag{5} H=Z×X(t)(5) Z = [ − C , C ] (6) Z=[-C,C]\tag{6} Z=[−C,C](6)在探索阶段结束时,进行群体操作。在探索阶段结束时,计算所有 G X GX GX个体的成本,如果成本满足 G X ( t ) < X ( t ) GX(t)
1.2 开发阶段
在GTO算法的开发阶段,采用了跟随银背大猩猩和竞争成年雌性的两种行为。银背大猩猩领导一个群体,做出所有决定,决定群体的行动,并引导大猩猩走向食物来源。它还负责团队的安全和福祉,团队中的所有大猩猩都遵守银背大猩猩的所有决策。另一方面,银背大猩猩可能会变弱、变老并最终死亡,群体中的黑背大猩猩可能会成为群体的领导者,或者其他雄性大猩猩可能会与银背大猩猩交战并主宰群体。如开发阶段使用的两种机制所述,可以使用式(2)中的数值选择跟随银背或竞争成年雌性。如果 C ≥ W C≥W C≥W,则选择跟随银背机制,但如果 C < W C
1.2.1 跟随银背大猩猩
如果 C ≥ W C≥W C≥W,则选择跟随银背大猩猩机制,式(7)模拟了此种行为。 G X ( t + 1 ) = L × M × ( X ( t ) − X s i l v e r b a c k ) + X ( t ) (7) GX(t+1)=L×M×(X(t)-X_{silverback})+X(t)\tag{7} GX(t+1)=L×M×(X(t)−Xsilverback)+X(t)(7) M = ( ∣ 1 N ∑ i = 1 N G X i ( t ) ∣ g ) 1 g (8) M=\left(\left|\frac1N\sum_{i=1}^NGX_i(t)\right|^g\right)^{\frac1g}\tag{8} M=(∣∣∣∣∣N1i=1∑NGXi(t)∣∣∣∣∣g)g1(8) g = 2 L (9) g=2^L\tag{9} g=2L(9)其中,在式(7)中, X ( t ) X(t) X(t)是大猩猩的位置向量, X s i l v e r b a c k X_{silverback} Xsilverback是银背大猩猩的位置向量(最佳位置),此外, L L L由式(4)计算, M M M由式(8)计算;在式(8)中, G X i ( t ) GX_i(t) GXi(t)表示每个候选大猩猩在第 t t t次迭代时的位置向量, N N N表示大猩猩个体的总数(种群规模), g g g由式(9)计算所得;在式(9)中, L L L由式(4)计算所得。
1.2.2 竞争成年雌性
如果 C < W C
在开发阶段结束时,进行一次群体操作,在该操作中,估计所有 G X GX GX个体的成本,如果成本满足 G X ( t ) < X ( t ) GX(t)
2、GTO算法伪代码
GTO算法伪代码如Algorithm 1所示。
Algorithm 1. Pseudocode of GTO
% GTO setting
Inputs: The population sizeNand maximum number of iterationsTand parametersβandp
Outputs: The location of Gorilla and its fitness value
% initialization
Initialize the random populationX i N( = 1 , 2 , , )…i
Calculate the fitness values of Gorilla
% Main Loop
while (stopping condition is not met) do
	Update theCusing Equation (2)
	Update theLusing Equation (4)
	% Exploration phase
	for (each Gorilla (Xi)) do
		Update the location Gorilla using Equation (1)
	end for
	% Create group
	Calculate the fitness values of Gorilla
	if GX is better than X, replace them
	Set Xsilverback as the location of silverback(best location)
	% Exploitation phase
	for (each Gorilla (Xi)) do
		if (|C|>=1) then
			Update the location Gorilla using Equation (7)
		Else
			Update the location Gorilla using Equation (10)
		End if
	end for
	% Create group
	Calculate the fitness values of Gorilla
	if New Solutions are better than previous solutions, replace them
	Set Xsilverback as the location of silverback(best location)
end while
Return XBestGorilla, bestFitness
二、仿真实验与分析
1、函数测试与数值分析
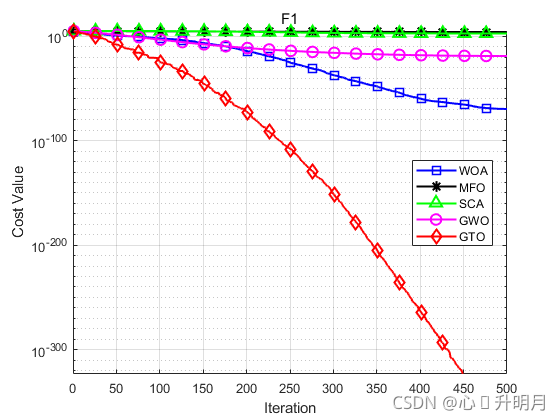
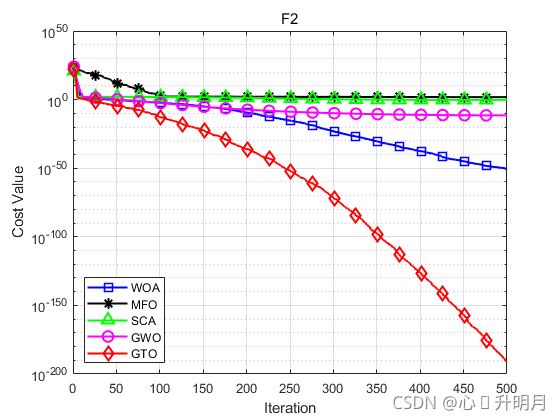
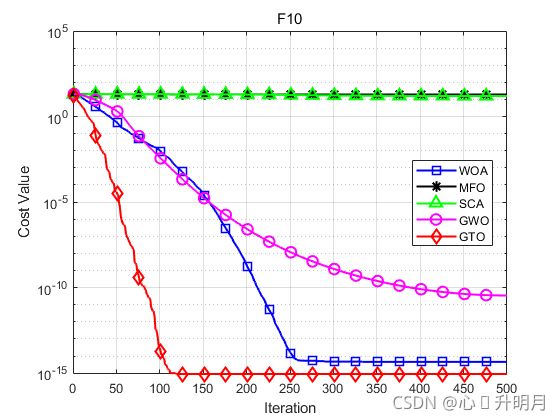
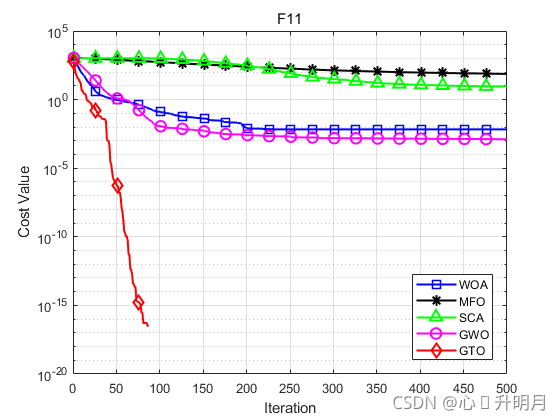
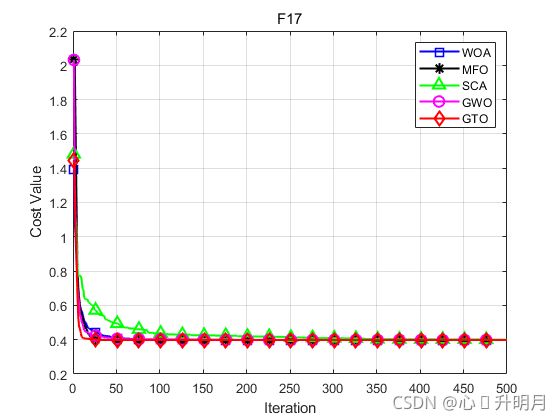
将GTO与WOA、MFO、SCA、GWO进行对比,以文献[1]中的F1、F2(单峰函数/50维)、F10、F11(多峰函数/50维)、F16、F17(固定维度多峰函数/2维)为例,种群规模设置为30,最大迭代次数设置为500,每个算法独立运算30次,以最差值、最优值、平均值、标准差和Wilcoxon秩和检验为评价指标,结果显示如下:

函数:F1
WOA:最差值: 6.9795e-69,最优值:3.9142e-85,平均值:2.3446e-70,标准差:1.274e-69,秩和检验:1.2118e-12
MFO:最差值: 41090.6903,最优值:433.785,平均值:11972.9225,标准差:11674.1559,秩和检验:1.2118e-12
SCA:最差值: 3804.1992,最优值:1.7025,平均值:530.8187,标准差:874.3239,秩和检验:1.2118e-12
GWO:最差值: 2.107e-18,最优值:8.5942e-21,平均值:1.399e-19,标准差:3.8176e-19,秩和检验:1.2118e-12
GTO:最差值: 0,最优值:0,平均值:0,标准差:0,秩和检验:NaN
函数:F2
WOA:最差值: 2.2876e-50,最优值:5.1496e-57,平均值:2.3153e-51,标准差:5.46e-51,秩和检验:3.0199e-11
MFO:最差值: 140.4765,最优值:6.5466,平均值:64.5082,标准差:29.6505,秩和检验:3.0199e-11
SCA:最差值: 2.0398,最优值:0.014625,平均值:0.60828,标准差:0.61398,秩和检验:3.0199e-11
GWO:最差值: 9.2835e-12,最优值:1.0292e-12,平均值:3.1213e-12,标准差:1.9198e-12,秩和检验:3.0199e-11
GTO:最差值: 1.7703e-190,最优值:1.0122e-205,平均值:6.4496e-192,标准差:0,秩和检验:1
函数:F10
WOA:最差值: 7.9936e-15,最优值:8.8818e-16,平均值:4.5593e-15,标准差:1.9755e-15,秩和检验:6.0659e-11
MFO:最差值: 19.965,最优值:15.6058,平均值:19.2824,标准差:1.0874,秩和检验:1.2118e-12
SCA:最差值: 20.5231,最优值:0.34339,平均值:15.7721,标准差:7.2122,秩和检验:1.2118e-12
GWO:最差值: 8.7376e-11,最优值:1.0439e-11,平均值:3.4402e-11,标准差:1.6926e-11,秩和检验:1.2118e-12
GTO:最差值: 8.8818e-16,最优值:8.8818e-16,平均值:8.8818e-16,标准差:0,秩和检验:NaN
函数:F11
WOA:最差值: 0.20369,最优值:0,平均值:0.0067895,标准差:0.037188,秩和检验:0.33371
MFO:最差值: 276.4017,最优值:4.5014,平均值:74.0601,标准差:71.1142,秩和检验:1.2118e-12
SCA:最差值: 34.8729,最优值:1.5049,平均值:9.185,标准差:8.893,秩和检验:1.2118e-12
GWO:最差值: 0.024779,最优值:0,平均值:0.0012933,标准差:0.0051205,秩和检验:0.021546
GTO:最差值: 0,最优值:0,平均值:0,标准差:0,秩和检验:NaN
函数:F16
WOA:最差值: -1.0316,最优值:-1.0316,平均值:-1.0316,标准差:2.74e-09,秩和检验:7.5741e-12
MFO:最差值: -1.0316,最优值:-1.0316,平均值:-1.0316,标准差:6.7752e-16,秩和检验:0.005466
SCA:最差值: -1.0314,最优值:-1.0316,平均值:-1.0316,标准差:6.018e-05,秩和检验:7.5741e-12
GWO:最差值: -1.0316,最优值:-1.0316,平均值:-1.0316,标准差:1.6532e-08,秩和检验:7.5741e-12
GTO:最差值: -1.0316,最优值:-1.0316,平均值:-1.0316,标准差:6.3208e-16,秩和检验:1
函数:F17
WOA:最差值: 0.39806,最优值:0.39789,平均值:0.3979,标准差:3.1196e-05,秩和检验:1.2118e-12
MFO:最差值: 0.39789,最优值:0.39789,平均值:0.39789,标准差:0,秩和检验:NaN
SCA:最差值: 0.41439,最优值:0.39823,平均值:0.40075,标准差:0.0034877,秩和检验:1.2118e-12
GWO:最差值: 0.40047,最优值:0.39789,平均值:0.39802,标准差:0.0005329,秩和检验:1.2118e-12
GTO:最差值: 0.39789,最优值:0.39789,平均值:0.39789,标准差:0,秩和检验:NaN
结果表明,GTO在基准函数上的性能优于比较算法。
2、GTO优化WSN覆盖
2.1 节点覆盖模型
本文采取0/1覆盖模型,具体描述请参考这里。
2.2 实验分析
设监测区域为 50 m × 50 m 50 m×50 m 50m×50m的二维平面,传感器节点个数 N = 35 N=35 N=35,其感知半径是 R s = 5 m R_s=5m Rs=5m,通信半径 R c = 10 m R_c=10m Rc=10m,迭代500次。初始部署、GTO优化覆盖、GTO算法覆盖率进化曲线如下图所示。
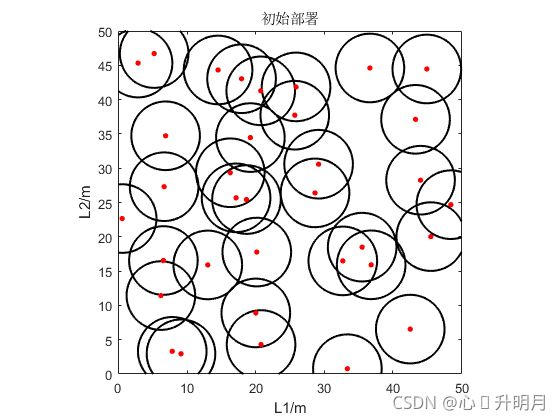

 初始部署和最终部署的节点位置及对应的覆盖率分别为:
初始位置:
2.8499     45.3227
20.782     4.2973
17.1401     25.6812
20.1596     17.7741
20.0144     8.9015
32.6971     16.4879
17.9388     43.0386
6.8683     34.7246
7.834     3.3052
48.4491     24.6809
19.2251     34.464
44.9446     44.4648
28.6492     26.4005
35.5175     18.4906
45.5247     20.0273
5.1986     46.7122
36.6481     44.6089
42.5279     6.5438
33.3661     0.77235
14.5134     44.319
29.1686     30.5809
6.5444     16.5424
6.1771     11.4316
44.0322     28.2498
25.8812     41.8494
13.0137     15.8989
9.1106     2.9481
16.294     29.3355
36.833     15.917
0.53388     22.6589
6.6508     27.3036
25.6934     37.7257
20.7327     41.2762
18.657     25.4305
43.3004     37.1266
初始覆盖率:0.71357
最优位置:
1.3946     46.6644
22.6456     2.0728
11     31.6405
27.5965     18.25
20.245     10.2144
36.3333     25.3793
17.4167     48.2375
4.479     33.7023
5.954     2.5759
45.9121     23.5528
21.5231     36.3741
45.667     44.2065
33.8457     32.2348
34.5949     11.3639
48.2218     14.637
4.3353     48.2136
35.6265     42.6812
43.2547     4.4374
32.6578     3.3147
11.57     41.2658
25.4642     27.9457
4.5679     16.366
4.2164     7.6486
46.3648     30.8661
27.1843     46.7991
13.5078     15.5399
13.2481     4.4368
14.3406     34.0741
40.3063     17.4307
1.4624     22.4294
9.8226     24.8553
27.7213     36.415
22.4113     42.8096
17.1023     24.43
42.5487     34.4973
最优覆盖率:0.85813
实验结果表明,GTO能够提升传感器节点的覆盖率,使得节点分布更加均匀。
三、参考文献
[1] Abdollahzadeh B, Gharehchopogh F S, Mirjalili S. Artificial gorilla troops optimizer: A new nature-inspired metaheuristic algorithm for global optimization problems[J]. International Journal of Intelligent Systems, 2021, 36: 5887–5958.