使用gcc的-finstrument-functions选项进行函数跟踪
https://blog.csdn.net/jasonchen_gbd/article/details/44044899
GCC Function instrumentation机制可以用来跟踪函数的调用关系,在gcc中对应的选项为“-finstrument-functions”。可查看gcc的man page来获取更详细信息。
编译时如果为gcc加上“-finstrument-functions”选项,那在每个函数的入口和出口处会各增加一个额外的hook函数的调用,增加的这两个函数分别为:
-
void __cyg_profile_func_enter (
void *this_fn,
void *call_site);
-
void __cyg_profile_func_exit (
void *this_fn,
void
call_site);
这是什么意思呢?例如我们写了一个函数func_test(),定义如下:
-
static void func_test(v)
-
{
-
/ your code… /
-
}
-
static void func_test(v)
-
{
-
__cyg_profile_func_enter(this_fn, call_site);
-
/ your code… */
-
__cyg_profile_func_exit(this_fn, call_site);
-
}
例如下面这段代码:
-
instrfunc.c:
-
#include
-
-
-
#define DUMP(func, call)
-
printf("%s: func = %p, called by = %p\n", FUNCTION, func, call)
-
-
-
void
attribute((no_instrument_function))
-
__cyg_profile_func_enter(
void *this_func,
void *call_site)
-
{
-
DUMP(this_func, call_site);
-
}
-
-
-
void
attribute((no_instrument_function))
-
__cyg_profile_func_exit(
void *this_func,
void *call_site)
-
{
-
DUMP(this_func, call_site);
-
}
-
-
-
int do_multi(int a, int b)
-
{
-
return a * b;
-
}
-
-
-
int do_calc(int a, int b)
-
{
-
return do_multi(a, b);
-
}
-
-
-
int main()
-
{
-
int a =
4, b =
5;
-
printf(
“result: %d\n”, do_calc(a, b));
-
return
0;
-
}
编译代码:
[zhenfg@ubuntu]code:$ gcc -finstrument-functions instrfunc.c -o instrfunc

[zhenfg@ubuntu]code:$ ./instrfunc

__cyg_profile_func_enter: func = 0x8048521, called by = 0xb75554e3

__cyg_profile_func_enter: func = 0x80484d8, called by = 0x8048562

__cyg_profile_func_enter: func = 0x804849a, called by = 0x8048504

__cyg_profile_func_exit: func = 0x804849a, called by = 0x8048504

__cyg_profile_func_exit: func = 0x80484d8, called by = 0x8048562

result: 20

__cyg_profile_func_exit: func = 0x8048521, called by = 0xb75554e3__cyg_profile_func_enter: func = 0x8048521(main), called by = 0xb75554e3
__cyg_profile_func_enter: func = 0x80484d8(do_calc), called by = 0x8048562(main)
__cyg_profile_func_enter: func = 0x804849a(do_multi), called by = 0x8048504(do_calc)
__cyg_profile_func_exit: func = 0x804849a(do_multi), called by = 0x8048504(do_calc)
__cyg_profile_func_exit: func = 0x80484d8(do_calc), called by = 0x8048562(main)
result: 20
__cyg_profile_func_exit: func = 0x8048521(main), called by = 0xb75554e3如果不想跟踪某个函数,可以给该函数指定“no_instrument_function”属性。需要注意的是,__cyg_profile_func_enter()和__cyg_profile_func_exit()这两个hook函数是一定要加上“no_instrument_function”属性的,不然,自己跟踪自己就会无限循环导致程序崩溃,当然,也不能在这两个hook函数中调用其他需要被跟踪的函数。
得到一系列的地址看起来不太直观,我们更希望看到函数名,幸运的是,addr2line工具为我们提供了这种可能。我们先看一下addr2line的使用方法:
[zhenfg@ubuntu]code:$ addr2line --help

Usage: addr2line [option(s)] [addr(s)]

Convert addresses into line number/file name pairs.

If no addresses are specified on the command line, they will be read from stdin

The options are:

@<file>                Read options from <file>

-a --addresses         Show addresses

-b --target=  Set the binary file format

-e --exe=  Set the input file name (default is a.out)

-i --inlines           Unwind inlined functions

-j --section=<name>    Read section-relative offsets instead of addresses

-p --pretty-print      Make the output easier to read for humans

-s --basenames         Strip directory names

-f --functions         Show function names

-C –demangle[=style]  Demangle function names

-h –help              Display this information

-v –version Display the program’s version 同样是上面的程序,我们加上-g选项再编译一次:
[zhenfg@ubuntu]code:$ gcc -g -finstrument-functions instrfunc.c -o instrfunc

[zhenfg@ubuntu]code:$ ./instrfunc

__cyg_profile_func_enter: func = 0x8048521, called by = 0xb757d4e3

__cyg_profile_func_enter: func = 0x80484d8, called by = 0x8048562

__cyg_profile_func_enter: func = 0x804849a, called by = 0x8048504

__cyg_profile_func_exit: func = 0x804849a, called by = 0x8048504

__cyg_profile_func_exit: func = 0x80484d8, called by = 0x8048562

result: 20

__cyg_profile_func_exit: func = 0x8048521, called by = 0xb757d4e3[zhenfg@ubuntu]code:$ addr2line -e instrfunc -a 0x8048504 -fp -s
0x08048504: do_calc at instrfunc.c:25另外,我们知道__builtin_return_address(level)宏可以获得不同层级的函数返回地址,但是在某些体系架构(如mips)中,__builtin_return_address(level)只能获得当前函数的直接调用者的地址,即level只能是0,那这时,就可使用上述方法来跟踪函数调用关系(mips中竟然能用,确实有些小吃惊)。
接下来可以看一下gcc是如何将hook函数嵌入各个函数中的,以反汇编代码中的do_multi()函数为例(这是mips的汇编代码),在mips中,ra寄存器用来存储返回地址,a0-a3用来做函数参数。
-
004006c8
:
-
4006c8:
27bdffd8 addiu sp,sp,
-40
-
4006cc: afbf0024 sw ra,
36(sp) ;;存储ra寄存器(返回地址)的值
-
4006d0: afbe0020 sw s8,
32(sp)
-
4006d4: afb1001c sw s1,
28(sp)
-
4006d8: afb00018 sw s0,
24(sp)
-
4006dc:
03a0f021 move s8,sp
-
4006e0:
03e08021 move s0,ra ;;s0 = ra
-
4006e4: afc40028 sw a0,
40(s8)
-
4006e8: afc5002c sw a1,
44(s8)
-
4006ec:
02001021 move v0,s0 ;;v0 = s0
-
4006f0:
3c030040 lui v1,
0x40
-
4006f4:
246406c8 addiu a0,v1,
1736 ;;将本函数的地址赋值给a0寄存器
-
4006f8:
00402821 move a1,v0 ;;将返回地址ra的值赋值给a1寄存器
-
4006fc:
0c100188 jal
400620 <__cyg_profile_func_enter> ;;调用hook函数
-
400700:
00000000 nop
-
400704:
8fc30028 lw v1,
40(s8)
-
400708:
8fc2002c lw v0,
44(s8)
-
40070c:
00000000 nop
-
400710:
00620018 mult v1,v0
-
400714:
00008812 mflo s1
-
400718:
02001021 move v0,s0
-
40071c:
3c030040 lui v1,
0x40
-
400720:
246406c8 addiu a0,v1,
1736 ;;将本函数的地址赋值给a0寄存器
-
400724:
00402821 move a1,v0 ;;将返回地址ra的值赋值给a1寄存器
-
400728:
0c10019d jal
400674 <__cyg_profile_func_exit> ;;调用hook函数
-
40072c:
00000000 nop
-
400730:
02201021 move v0,s1
-
400734:
03c0e821 move sp,s8
-
400738:
8fbf0024 lw ra,
36(sp) ;;恢复ra寄存器(返回地址)的值
-
40073c:
8fbe0020 lw s8,
32(sp)
-
400740:
8fb1001c lw s1,
28(sp)
-
400744:
8fb00018 lw s0,
24(sp)
-
400748:
27bd0028 addiu sp,sp,
40
-
40074c:
03e00008 jr ra
-
400750:
00000000 nop
https://blog.csdn.net/u014608280/article/details/82669330
我们在阅读源码的时候经常会碰到很多回调函数,而单步调试又比较麻烦,所以我们可以用gcc 的-finstrument-functions 选项打印函数调用栈。
如果我们在编译、链接的时候在gcc加上-finstrument-functions,gcc会自动在函数的入口调用 __cyg_profile_func_enter函数,在函数出口调用__cyg_profile_func_exit函数。参数this_fn 为当前函数的起始地址,call_site为返回地址,即caller函数中的地址。注意inline函数也会调用这两个函数,如果不想调用这两个函数,在声明函数时增加no_instrument_function属性。
-
void __cyg_profile_func_enter (
void *this_fn,
void *call_site);
-
void __cyg_profile_func_exit (
void *this_fn,
void *call_site);
举例说明,假如我们有函数
-
void
func ()
-
{
-
printf(
"Hello world!\n");
-
}
在编译时gcc增加了-finstrument-functions选项,函数就会变成
-
void func()
-
{
-
__cyg_profile_func_enter(this_fn, call_site);
-
printf(
"Hello world!\n");
-
__cyg_profile_func_exit(this_fn, call_site);
-
-
}
如果不想让这个函数调用,声明时我们需要这样
void func() __attribute__((no_instrument_function));
顺便说一下__attribute__关键字
作用:__attribute__可以设置函数属性,变量属性和类型属性。
格式:放在声明的尾部;之前,attribute之前和后面各有两个下划线,后面是一对括弧,括弧里是相应的属性。
举例:(packed属性)如下结构体
-
typedef
struct STUDENT
-
{
-
int age;
-
char c;
-
}student;
我们sizeof这个结构体会发现结果是8,这是因为编译器会对结构体调整,内存对齐的结果。如果我们不需要内存对齐,可以这样声明
-
typedef
struct STUDENT
-
{
-
int age;
-
char c;
-
}__attribute__((packed)) student;
我们再sizeof结果就会为5.
再来一个__attribute__((weak))
当我们不确定外部是否提供一个函数func时,但是我们又必须使用这个函数,就可以用到__attribute__((weak))
-
int __attribute__((weak)) func(......)
-
-
{
-
........
-
return
0;
-
-
}
他的作用是当外部定义func函数时,调用外部的func函数,当外部没有定义func函数时,调用自己定义的func函数。即将本模块的func转成弱符号类型,如果遇到强符号类型(即外部模块定义了func),那么我们在本模块执行的func将会是外部模块定义的func。注意:weak属性只会在静态库(.o .a )中生效,动态库(.so)中不会生效。
言归正传
我们有程序finstrument.c
-
#include
-
#include
-
-
int func(int a, int b)
-
{
-
return a + b;
-
}
-
-
static inline void print(int n)
-
{
-
printf(
"%d\n", n);
-
}
-
-
int main()
-
{
-
func(
3,
4);
-
print(func(
3,
4));
-
return
0;
-
}
实现__cyg_profile_func_enter和__cyg_profile_func_exit函数在my_debug.c中
-
#ifndef __MY_DEBUG_H__
-
#define __MY_DEBUG_H__
-
-
#include
-
-
void __attribute__((no_instrument_function)) debuf_log(
const
char *format,...);
-
void __attribute__((no_instrument_function)) __cyg_profile_func_enter(
void*,
void*);
-
void __attribute__((no_instrument_function)) __cyg_profile_func_enter(
void*,
void*);
-
-
-
#endif
-
#include
-
#include
-
#include "my_debug.h"
-
-
#define DEBUG_FILE_PATH "./mydebug.log"
-
-
void __attribute__((no_instrument_function))
-
debug_log(
const
char *format,...)
-
{
-
FILE *fp;
-
va_list ap;
-
va_start(ap, format);
-
-
fp = fopen(DEBUG_FILE_PATH,
"a");
-
if(
NULL == fp)
-
{
-
printf(
"Can not open debug file.\n");
-
return;
-
}
-
vfprintf(fp, format, ap);
-
va_end(ap);
-
fflush(fp);
-
fclose(fp);
-
}
-
-
void __attribute__((no_instrument_function))
-
__cyg_profile_func_enter(
void *
this,
void *call)
-
{
-
debug_log(
"Enter\n%p\n%p\n", call,
this);
-
}
-
-
void __attribute__((no_instrument_function))
-
__cyg_profile_func_exit(
void *
this,
void *call)
-
{
-
debug_log(
"Exit\n%p\n%p\n", call,
this);
-
}
编译命令
gcc finstrument.c my_debug.c -g -finstrument-functions -o finstrument
执行可执行文件生成mydebug.log文件

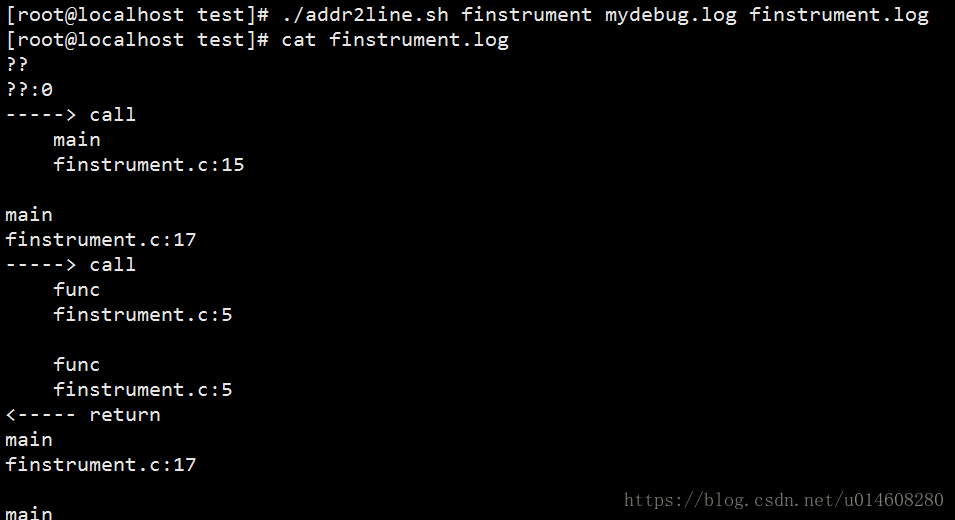
看不懂没关系,我们addr2line工具

一条条转换太麻烦,可以用如下脚本批量转换
-
#!/bin/sh
-
-
if [
$# != 3 ];
then
-
echo
'Usage: addr2line.sh executefile addressfile functionfile'
-
exit
-
fi;
-
-
cat
$2 |
while
read line
-
do
-
if [
"$line" =
'Enter' ];
then
-
read line1
-
read line2
-
addr2line -e
$1 -f
$line1 -s >>
$3
-
echo
"-----> call" >>
$3
-
addr2line -e
$1 -f
$line2 -s | sed
's/^/ /' >>
$3
-
echo >>
$3
-
elif [
"$line" =
'Exit' ];
then
-
read line1
-
read line2
-
addr2line -e
$1 -f
$line2 -s | sed
's/^/ /' >>
$3
-
echo
"<----- return" >>
$3
-
addr2line -e
$1 -f
$line1 -s >>
$3
-
echo >>
$3
-
fi;
-
done
20190519
2.GCC的-finstrument-functions 参数
编译的时候需要增加增加-finstrument-functions选项,同时增加 –g选项,生成符号信息
原理:在程序中加入hook,让它在每次进入和退出函数的时候分别调用下面这两个函数:
void __cyg_profile_func_enter( void *func_address, void *call_site )

 void __cyg_profile_func_exit ( void *func_address, void *call_site )
例如,void f1( ) __attribute__ ((no_instrument_function));
这里获得的是函数地址,用addr2line -f 可以找到地址对应的函数名称。
例子:
首先要在函数中加入定义
#include
#define DUMP(func, call) printf("%s: func = %p, called by = %p/n", FUNCTION, func, call)
void attribute((no_instrument_function))
__cyg_profile_func_enter(void *this_func, void *call_site)
{
DUMP(this_func, call_site);
}
void attribute((no_instrument_function))
__cyg_profile_func_exit(void *this_func, void *call_site)
{
DUMP(this_func, call_site);
}
得到结果:
 ./hello
__cyg_profile_func_enter: func = 0x8048438, called by = 0x658dec/nHello World!
__cyg_profile_func_exit: func = 0x8048438, called by = 0x658dec/n
在Windows下的codeblocks里没有进入和退出结果。
后来在维基百科上看到,不止两个得出动态调用图的工具
-
Run-time call-graph (most of tools listed are profilers with callgraph functionality)
- gprof : included in BSD or part of the GNU Binary Utilities
- callgrind : part of Valgrind
- KCachegrind : powerful tool to generate and analyze call graphs based on data generated by callgrind
- Mac OS X Activity Monitor : Apple GUI process monitor Activity Monitor has a built-in call graph generator that can sample processes and return a call graph. This function is only available in Mac OS X Leopard
- OpenPAT : includes the
control_flowtool which automatically creates a Graphviz call-graph picture from runtime measurements. - pprof, open source tool for visualization and analysis of profile data, to be used in conjunction with gperftools.
- CodeAnalyst from AMD (released under GPL)
- makeppgraph is a dependency graph generator (at module level) for builds performed with makepp.
- Intel(R) Single Event API (free, open-source)