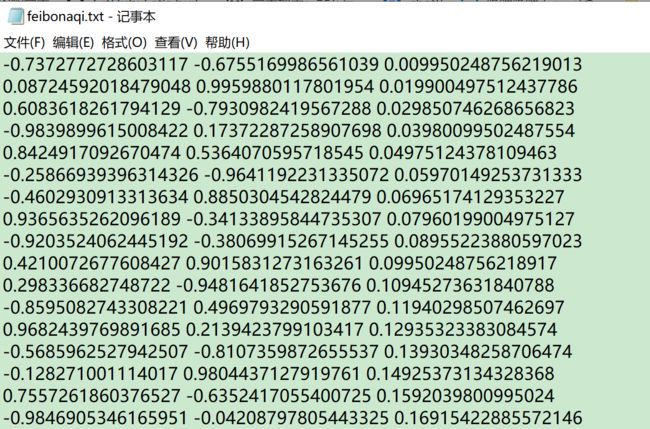
【Fibonacci sphere sampling method】
在球面生成均匀的采样点——Fibonacci sphere sampling method
参考:DiLiGenT102: A Photometric Stereo Benchmark Dataset with Controlled Shape and Material Variation Supplementary Material


代码:
python
import numpy as np
import os

from scipy.spatial.distance import cdist

R = (1 + np.sqrt(5)) / 2

def sph_to_cart(sph_co_ords):

    # allow for lack of r value (i.e. for unit sphere)
    if sph_co_ords.shape[1] < 3:
        theta, phi = sph_co_ords[:,0], sph_co_ords[:,1]
        r = 1

    else:
        r, theta, phi = sph_co_ords[:,0], sph_co_ords[:,1], sph_co_ords[:,2]

    x = r * np.cos(theta) * np.sin(phi)
    y = r * np.sin(theta) * np.sin(phi)
    z = r * np.cos(phi)

    return np.array([x, y, z]).T

def fibonacci(co_ords='sph'):
    # quasi-regular sampling using fibonacci spiral

    i = np.arange(1,101)

    theta = 2*np.pi*i/R
    # arccos as we use spherical co-ordinates rather than lat-lon
    phi = np.arccos(2*i/201)

    if co_ords == 'cart':
        return sph_to_cart(np.array([theta, phi]).T)

    elif co_ords == 'sph':
        return np.array([theta, phi]).T % (2*np.pi)

if __name__=='__main__':

    verts = fibonacci( co_ords='cart')
    # print(verts)


    import matplotlib.pyplot as plt

    from mpl_toolkits.mplot3d import Axes3D
    fig = plt.figure()
    ax = fig.add_subplot(111, projection='3d')

    x = np.array([p[0] for p in verts if p[2]>=0])
    y = np.array([p[1] for p in verts if p[2]>=0])
    z = np.array([p[2] for p in verts if p[2]>=0])
    for i,j,k in zip(x,y,z):
        print(i,j,k)

    print(len(x))


    d = x ** 2 + y ** 2 + z ** 2
    # print(d)

    ax.scatter(x, y, z, c='r', marker='o')

    ax.set_xlabel('X Label')
    ax.set_ylabel('Y Label')
    ax.set_zlabel('Z Label')

    plt.show()
其中i = np.arange(1,101) 为1-100整数,共生成上半球面100个点。
matlab
[x,y,z] = sphere(50);

% 缩放球体并绘制
r = 1; % 半径设置为 1
x = x * r;
y = y * r;
z = z * r;

% 创建一个图形对象,并设置旋转模式
figure;
rotate3d on;
h_surf = surf(x, y, z, 'EdgeColor', 'none', 'FaceAlpha', 0.7);

% 定义旋转的速度和方向
w = 10;
v = [0 0 1];

% 循环旋转球体

% 计算每一帧旋转的角度
dtheta = w * pi / 180; % 角度转弧度
R = [cos(dtheta), -sin(dtheta), 0;
     sin(dtheta), cos(dtheta), 0;
     0, 0, 1];

% 旋转球体
xyz = [x(:) y(:) z(:)];
xyz_rotated = xyz * R;
x_rotated = reshape(xyz_rotated(:,1), size(x));
y_rotated = reshape(xyz_rotated(:,2), size(y));
z_rotated = reshape(xyz_rotated(:,3), size(z));

% 更新球体的坐标
set(h_surf, 'XData', x_rotated, 'YData', y_rotated, 'ZData', z_rotated);
hold on;

fid = fopen('D:\Users\time\Desktop\dataset\feibonaqi.txt', 'r'); % 打开文件
data = textscan(fid, '%f %f %f'); % 读取每一行数据并转换为浮点数
fclose(fid); % 关闭文件

x = data{1}; % x坐标
y = data{2}; % y坐标
z = data{3}; % z坐标

for i = 1:numel(x)
    plot3(x(i), y(i), z(i), 'rp'); % 绘制球面上的一个点
end

xlabel('x'),ylabel('y'),zlabel('z');
