每位linux系统管理员必须知道的20条监控工具
- Finding out bottlenecks.
- Disk (storage) bottlenecks.
- CPU and memory bottlenecks.
- Network bottlenecks.
#1: top - Process Activity CommandThe top program provides a dynamic real-time view of a runningsystem i.e. actual process activity. By default, it displays the mostCPU-intensive tasks running on the server and updates the list everyfive seconds.
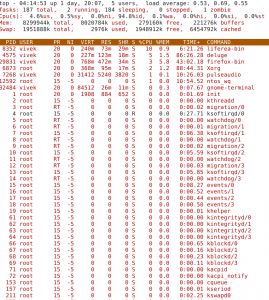 Fig.01: Linux top command
Commonly Used Hot KeysThe top command provides several useful hot keys:
| Hot Key | Usage |
| t | Displays summary information off and on. |
| m | Displays memory information off and on. |
| A | Sorts the display by top consumers of various system resources.Useful for quick identification of performance-hungry tasks on a system. |
| f | Enters an interactive configuration screen for top. Helpful for setting up top for a specific task. |
| o | Enables you to interactively select the ordering within top. |
| r | Issues renice command. |
| k | Issues kill command. |
| z | Turn on or off color/mono |
=> Related: How do I Find Out Linux CPU Utilization?
#2: vmstat - System Activity, Hardware and System InformationThe command vmstat reports information about processes, memory, paging, block IO, traps, and cpu activity.
# vmstat 3
Sample Outputs:
procs -----------memory---------- ---swap-- -----io---- --system-- -----cpu------
r b swpd free buff cache si so bi bo in cs us sy id wa st
0 0 0 2540988 522188 5130400 0 0 2 32 4 2 4 1 96 0 0
1 0 0 2540988 522188 5130400 0 0 0 720 1199 665 1 0 99 0 0
0 0 0 2540956 522188 5130400 0 0 0 0 1151 1569 4 1 95 0 0
0 0 0 2540956 522188 5130500 0 0 0 6 1117 439 1 0 99 0 0
0 0 0 2540940 522188 5130512 0 0 0 536 1189 932 1 0 98 0 0
0 0 0 2538444 522188 5130588 0 0 0 0 1187 1417 4 1 96 0 0
0 0 0 2490060 522188 5130640 0 0 0 18 1253 1123 5 1 94 0 0Display Memory Utilization Slabinfo# vmstat -m
Get Information About Active / Inactive Memory Pages# vmstat -a
=> Related: How do I find out Linux Resource utilization to detect system bottlenecks?
#3: w - Find Out Who Is Logged on And What They Are Doingw command displays information about the users currently on the machine, and their processes.
# w username
# w vivek
Sample Outputs:
17:58:47 up 5 days, 20:28, 2 users, load average: 0.36, 0.26, 0.24
USER TTY FROM LOGIN@ IDLE JCPU PCPU WHAT
root pts/0 10.1.3.145 14:55 5.00s 0.04s 0.02s vim /etc/resolv.conf
root pts/1 10.1.3.145 17:43 0.00s 0.03s 0.00s w
#4: uptime - Tell How Long The System Has Been RunningThe uptime command can be used to see how long the server has beenrunning. The current time, how long the system has been running, howmany users are currently logged on, and the system load averages forthe past 1, 5, and 15 minutes.
# uptime
Output:
18:02:41 up 41 days, 23:42, 1 user, load average: 0.00, 0.00, 0.001 can be considered as optimal load value. The load can change fromsystem to system. For a single CPU system 1 - 3 and SMP systems 6-10load value might be acceptable.
#5: ps - Displays The Processesps command will report a snapshot of the current processes. To select all processes use the -A or -e option:
# ps -A
Sample Outputs:
PID TTY TIME CMD
1 ? 00:00:02 init
2 ? 00:00:02 migration/0
3 ? 00:00:01 ksoftirqd/0
4 ? 00:00:00 watchdog/0
5 ? 00:00:00 migration/1
6 ? 00:00:15 ksoftirqd/1
....
.....
4881 ? 00:53:28 java
4885 tty1 00:00:00 mingetty
4886 tty2 00:00:00 mingetty
4887 tty3 00:00:00 mingetty
4888 tty4 00:00:00 mingetty
4891 tty5 00:00:00 mingetty
4892 tty6 00:00:00 mingetty
4893 ttyS1 00:00:00 agetty
12853 ? 00:00:00 cifsoplockd
12854 ? 00:00:00 cifsdnotifyd
14231 ? 00:10:34 lighttpd
14232 ? 00:00:00 php -cgi
54981 pts/0 00:00:00 vim
55465 ? 00:00:00 php-cgi
55546 ? 00:00:00 bind 9-snmp -stat
55704 pts/1 00:00:00 psps is just like top but provides more information.
Show Long Format Output# ps -Al
To turn on extra full mode (it will show command line arguments passed to process):
# ps -AlF
To See Threads ( LWP and NLWP)# ps -AlFH
To See Threads After Processes# ps -AlLm
Print All Process On The Server# ps ax
# ps axu
Print A Process Tree# ps -ejH
# ps axjf
# pstree
Print Security Information# ps -eo euser,ruser,suser,fuser,f,comm,label
# ps axZ
# ps -eM
See Every Process Running As User Vivek# ps -U vivek -u vivek u
Set Output In a User-Defined Format# ps -eo pid,tid,class,rtprio,ni,pri,psr,pcpu,stat,wchan:14,comm
# ps axo stat,euid,ruid,tty,tpgid,sess,pgrp,ppid,pid,pcpu,comm
# ps -eopid,tt,user,fname,tmout,f,wchan
Display Only The Process IDs of Lighttpd# ps -C lighttpd -o pid=
OR
# pgrep lighttpd
OR
# pgrep -u vivek php-cgi
Display The Name of PID 55977# ps -p 55977 -o comm=
Find Out The Top 10 Memory Consuming Process# ps -auxf | sort -nr -k 4 | head -10
Find Out top 10 CPU Consuming Process# ps -auxf | sort -nr -k 3 | head -10
#6: free - Memory UsageThe command free displays the total amount of free and used physicaland swap memory in the system, as well as the buffers used by thekernel.
# free
Sample Output:
total used free shared buffers cached
Mem: 12302896 9739664 2563232 0 523124 5154740
-/+ buffers/cache: 4061800 8241096
Swap: 1052248 0 1052248=> Related: :
- Linux Find Out Virtual Memory PAGESIZE
- Linux Limit CPU Usage Per Process
- How much RAM does my Ubuntu / Fedora Linux desktop PC have?
#7: iostat - Average CPU Load, Disk ActivityThe command iostat report Central Processing Unit (CPU) statisticsand input/output statistics for devices, partitions and networkfilesystems (NFS).
# iostat
Sample Outputs:
Linux 2.6.18-128.1.14.el5 (www03.nixcraft.in) 06/26/2009
avg-cpu: %user %nice %system %iowait %steal %idle
3.50 0.09 0.51 0.03 0.00 95.86
Device: tps Blk_read/s Blk_wrtn/s Blk_read Blk_wrtn
sda 22.04 31.88 512.03 16193351 260102868
sda1 0.00 0.00 0.00 2166 180
sda2 22.04 31.87 512.03 16189010 260102688
sda3 0.00 0.00 0.00 1615 0=> Related: : Linux Track NFS Directory / Disk I/O Stats
#8: sar - Collect and Report System ActivityThe sar command is used to collect, report, and save system activity information. To see network counter, enter:
# sar -n DEV | more
To display the network counters from the 24th:
# sar -n DEV -f /var/log/sa/sa24 | more
You can also display real time usage using sar:
# sar 4 5
Sample Outputs:
Linux 2.6.18-128.1.14.el5 (www03.nixcraft.in) 06/26/2009
06:45:12 PM CPU %user %nice %system %iowait %steal %idle
06:45:16 PM all 2.00 0.00 0.22 0.00 0.00 97.78
06:45:20 PM all 2.07 0.00 0.38 0.03 0.00 97.52
06:45:24 PM all 0.94 0.00 0.28 0.00 0.00 98.78
06:45:28 PM all 1.56 0.00 0.22 0.00 0.00 98.22
06:45:32 PM all 3.53 0.00 0.25 0.03 0.00 96.19
Average: all 2.02 0.00 0.27 0.01 0.00 97.70=> Related: : How to collect Linux system utilization data into a file
#9: mpstat - Multiprocessor UsageThe mpstat command displays activities for each available processor,processor 0 being the first one. mpstat -P ALL to display average CPUutilization per processor:
# mpstat -P ALL
Sample Output:
Linux 2.6.18-128.1.14.el5 (www03.nixcraft.in) 06/26/2009
06:48:11 PM CPU %user %nice %sys %iowait %irq %soft %steal %idle intr/s
06:48:11 PM all 3.50 0.09 0.34 0.03 0.01 0.17 0.00 95.86 1218.04
06:48:11 PM 0 3.44 0.08 0.31 0.02 0.00 0.12 0.00 96.04 1000.31
06:48:11 PM 1 3.10 0.08 0.32 0.09 0.02 0.11 0.00 96.28 34.93
06:48:11 PM 2 4.16 0.11 0.36 0.02 0.00 0.11 0.00 95.25 0.00
06:48:11 PM 3 3.77 0.11 0.38 0.03 0.01 0.24 0.00 95.46 44.80
06:48:11 PM 4 2.96 0.07 0.29 0.04 0.02 0.10 0.00 96.52 25.91
06:48:11 PM 5 3.26 0.08 0.28 0.03 0.01 0.10 0.00 96.23 14.98
06:48:11 PM 6 4.00 0.10 0.34 0.01 0.00 0.13 0.00 95.42 3.75
06:48:11 PM 7 3.30 0.11 0.39 0.03 0.01 0.46 0.00 95.69 76.89=> Related: : Linux display each multiple SMP CPU processors utilization individually .
#10: pmap - Process Memory UsageThe command pmap report memory map of a process. Use this command to find out causes of memory bottlenecks.
# pmap -d PID
To display process memory information for pid # 47394, enter:
# pmap -d 47394
Sample Outputs:
47394: /usr/bin/php-cgi
Address Kbytes Mode Offset Device Mapping
0000000000400000 2584 r-x-- 0000000000000000 008:00002 php-cgi
0000000000886000 140 rw--- 0000000000286000 008:00002 php-cgi
00000000008a9000 52 rw--- 00000000008a9000 000:00000 [ anon ]
0000000000aa8000 76 rw--- 00000000002a8000 008:00002 php-cgi
000000000f678000 1980 rw--- 000000000f678000 000:00000 [ anon ]
000000314a600000 112 r-x-- 0000000000000000 008:00002 ld-2.5.so
000000314a81b000 4 r---- 000000000001b000 008:00002 ld-2.5.so
000000314a81c000 4 rw--- 000000000001c000 008:00002 ld-2.5.so
000000314aa00000 1328 r-x-- 0000000000000000 008:00002 libc-2.5.so
000000314ab4c000 2048 ----- 000000000014c000 008:00002 libc-2.5.so
.....
......
..
00002af8d48fd000 4 rw--- 0000000000006000 008:00002 xsl.so
00002af8d490c000 40 r-x-- 0000000000000000 008:00002 libnss_files-2.5.so
00002af8d4916000 2044 ----- 000000000000a000 008:00002 libnss_files-2.5.so
00002af8d4b15000 4 r---- 0000000000009000 008:00002 libnss_files-2.5.so
00002af8d4b16000 4 rw--- 000000000000a000 008:00002 libnss_files-2.5.so
00002af8d4b17000 768000 rw-s- 0000000000000000 000:00009 zero (deleted)
00007fffc95fe000 84 rw--- 00007ffffffea000 000:00000 [ stack ]
ffffffffff600000 8192 ----- 0000000000000000 000:00000 [ anon ]
mapped: 933712K writeable/private: 4304K shared: 768000KThe last line very important:
- mapped: 933712K total amount of memory mapped to files
- writeable/private: 4304K the amount of private address space
- shared: 768000K the amount of address space this process is sharing with others
=> Related: : Linux find the memory used by a program / process using pmap command
#11 and #12: netstat and ss - Network StatisticsThe command netstat displays network connections, routing tables,interface statistics, masquerade connections, and multicastmemberships. ss command is used to dump socket statistics. It allowsshowing information similar to netstat. See the following resourcesabout ss and netstat commands:
- ss: Display Linux TCP / UDP Network and Socket Information
- Get Detailed Information About Particular IP address Connections Using netstat Command
#13: iptraf - Real-time Network StatisticsThe iptraf command is interactive colorful IP LAN monitor. It is anncurses-based IP LAN monitor that generates various network statisticsincluding TCP info, UDP counts, ICMP and OSPF information, Ethernetload info, node stats, IP checksum errors, and others. It can providethe following info in easy to read format:
- Network traffic statistics by TCP connection
- IP traffic statistics by network interface
- Network traffic statistics by protocol
- Network traffic statistics by TCP/UDP port and by packet size
- Network traffic statistics by Layer2 address
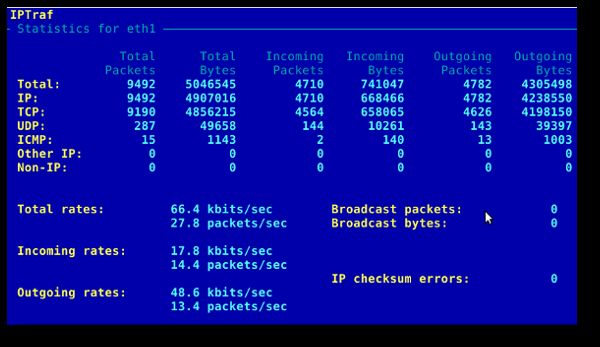 Fig.02: General interface statistics: IP traffic statistics by network interface
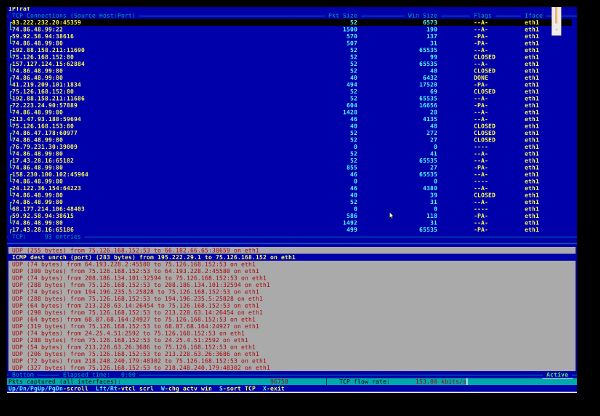 Fig.03 Network traffic statistics by TCP connection
#14: tcpdump - Detailed Network Traffic AnalysisThe tcpdump is simple command that dump traffic on a network.However, you need good understanding of TCP/IP protocol to utilize thistool. For.e.g to display traffic info about DNS, enter:
# tcpdump -i eth1 'udp port 53'
To display all IPv4 HTTP packets to and from port 80, i.e. print onlypackets that contain data, not, for example, SYN and FIN packets andACK-only packets, enter:
# tcpdump 'tcp port 80 and (((ip[2:2] - ((ip[0]&0xf)<<2)) - ((tcp[12]&0xf0)>>2)) != 0)'
To display all FTP session to 202.54.1.5, enter:
# tcpdump -i eth1 'dst 202.54.1.5 and (port 21 or 20'
To display all HTTP session to 192.168.1.5:
# tcpdump -ni eth0 'dst 192.168.1.5 and tcp and port http'
Use wireshark to view detailed information about files, enter:
# tcpdump -n -i eth1 -s 0 -w output.txt src or dst port 80
#15: strace - System CallsTrace system calls and signals. This is useful for debugging web server and other server problems. See how to use to trace the process and see What it is doing.
#16: /Proc file system - Various Kernel Statistics/proc file system provides detailed information about various hardware devices and other Linux kernel information. See Linux kernel /proc documentations for further details. Common /proc examples:
# cat /proc/cpuinfo
# cat /proc/meminfo
# cat /proc/zoneinfo
# cat /proc/mounts
17#: Nagios - Server And Network MonitoringNagios is apopular open source computer system and network monitoring applicationsoftware. You can easily monitor all your hosts, network equipment andservices. It can send alert when things go wrong and again when theyget better. FAN is "Fully Automated Nagios". FAN goals are to provide a Nagiosinstallation including most tools provided by the Nagios Community. FANprovides a CDRom image in the standard ISO format, making it easy toeasilly install a Nagios server. Added to this, a wide bunch of toolsare including to the distribution, in order to improve the userexperience around Nagios.
18#: Cacti - Web-based Monitoring ToolCacti is a complete network graphing solution designed to harnessthe power of RRDTool's data storage and graphing functionality. Cactiprovides a fast poller, advanced graph templating, multiple dataacquisition methods, and user management features out of the box. Allof this is wrapped in an intuitive, easy to use interface that makessense for LAN-sized installations up to complex networks with hundredsof devices. It can provide data about network, CPU, memory, logged inusers, Apache , DNS servers and much more. See how to install and configure Cacti network graphing tool under CentOS / RHEL.
#19: KDE System Guard - Real-time Systems Reporting and GraphingKSysguard is a network enabled task and system monitor applicationfor KDE desktop. This tool can be run over ssh session. It provideslots of features such as a client/server architecture that enablesmonitoring of local and remote hosts. The graphical front end usesso-called sensors to retrieve the information it displays. A sensor canreturn simple values or more complex information like tables. For eachtype of information, one or more displays are provided. Displays areorganized in worksheets that can be saved and loaded independently fromeach other. So, KSysguard is not only a simple task manager but also avery powerful tool to control large server farms.
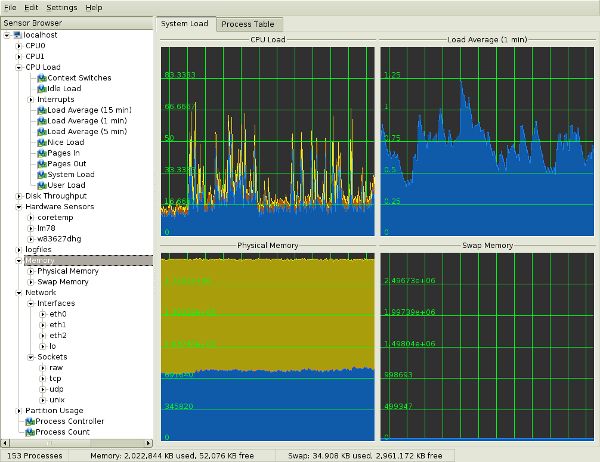 Fig.05 KDE System Guard {Image credit: Wikipedia}
See the KSysguard handbook for detailed usage.
#20: Gnome System Monitor - Real-time Systems Reporting and GraphingThe System Monitor application enables you to display basic systeminformation and monitor system processes, usage of system resources,and file systems. You can also use System Monitor to modify thebehavior of your system. Although not as powerful as the KDE SystemGuard, it provides the basic information which may be useful for newusers:
- Displays various basic information about the computer's hardware and software.
- Linux Kernel version
- GNOME version
- Hardware
- Installed memory
- Processors and speeds
- System Status
- Currently available disk space
- Processes
- Memory and swap space
- Network usage
- File Systems
- Lists all mounted filesystems along with basic information about each.
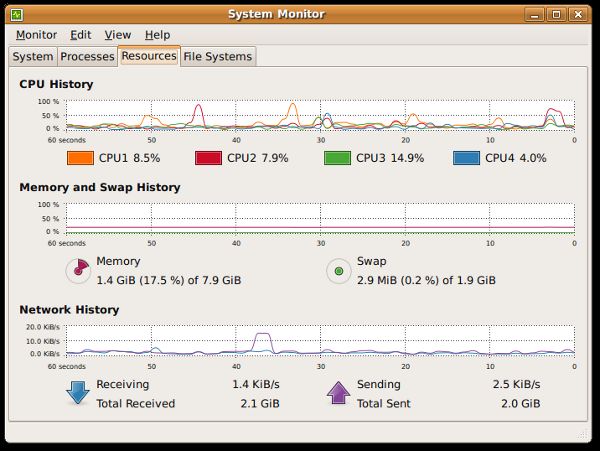 Fig.06 The Gnome System Monitor application
Bounce: Additional ToolsA few more tools:
- nmap - scan your server for open ports.
- lsof - list open files, network connections and much more.
- ntop web based tool - ntop is the best tool to see network usage in a waysimilar to what top command does for processes i.e. it is networktraffic monitoring software. You can see network status, protocol wisedistribution of traffic for UDP, TCP, DNS, HTTP and other protocols.
- Conky -Another good monitoring tool for the X Window System. It is highlyconfigurable and is able to monitor many system variables including thestatus of the CPU, memory, swap space, disk storage, temperatures,processes, network interfaces, battery power, system messages, e-mailinboxes etc.
- GKrellM - It can be used to monitor the status of CPUs, main memory, harddisks, network interfaces, local and remote mailboxes, and many otherthings.
- vnstat - vnStat is a console-based network traffic monitor. It keeps a log ofhourly, daily and monthly network traffic for the selected interface(s).
- htop - htop is an enhanced version of top, the interactive process viewer, which can display the list of processes in a tree form.
- mtr - mtr combines the functionality of the traceroute and ping programs in a single network diagnostic tool.
Did I miss something? Please add your favorite system motoring tool in the comments.