薄板样条差值
薄板样条插值
一。问题引入
已知三维空间存在一些点集(x,y,z),现想通过差值的方法插入一些点形成一个光滑的面,问题在于怎么确定免得方程,得到面的方程的方法很多,介绍下薄板样条差值。
二。 差值方法
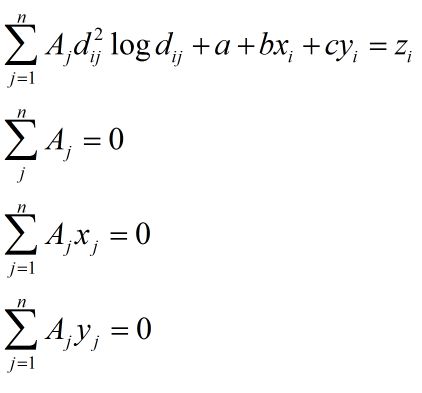
设已知的点集为{X1,X2,....Xj,.......Xn},其中X=(x,y,z),下面不加证明的给出任意待插入点(x,y)的差值方程
上述公式中共有N+3个系数,系数有下面的公式确定
联立求解上述方程,即可求出插值面的系数,而后带入任意的待插值点(x,y),即可求出其z值。样条差值的求解步骤如下:
3. MATLAB 代码
clear;
clc;
%%
%已知点x/3+y/4+y/5=1
point_group=[3 0 0;0 4 0;0 0 5;3 -4 5;-3 4 5;3 4 -5;6 -4 0;6 0 -5;0 8 -5;-3 8 0;0 -4 10;-3 0 10];  % 已知点
%差值范围
x=-5:0.1:5;
y=-5:0.1:5;
[xx,yy]=meshgrid(x,y);
[m,n]=size(xx);
%待插值点
point_est =zeros(m*n,3);
point_est(:,1)=xx(:);
point_est(:,2)=yy(:);

l=length(point_group);
distance=zeros(l); %构建已知点距离矩阵
for i=1:l
    for j=i+1:l
        tmp=norm(point_group(i,1:2)-point_group(j,1:2));
        distance(i,j)=tmp^2*log(tmp);
    end
end
distance=distance+distance';

distance2=zeros(m*n,l); % 带插入点到已知点的距离矩阵
for i=1:m*n
    for j=1:l
        tmp=norm(point_est(i,1:2)-point_group(j,1:2))^2;
        distance2(i,j)=tmp^2*log(tmp);
    end
end

%%
R=zeros(l+3);   % 距离矩阵R
   R1=distance;
   R2=[ones(l,1),point_group(:,1:2)];
   R3=R2';
   R4=zeros(3);
R=[R1,R2;R3,R4];

Z=zeros(l+3,1);
Z(1:l)=point_group(:,3);  % z值矩阵
coff=R\Z;    %系数矩阵A
%%
R2=zeros(m*n+3,l+3);
     R21=distance2;
     R22=[ones(m*n,1),point_est(:,1:2)];
R2=[R21,R22];
point_est(:,3)=R2*coff;  %插值点的Z值


scatter3(point_est(:,1),point_est(:,2),point_est(:,3))
hold on
scatter3(3,0,0,'red')
scatter3(0,4,0,'red')
scatter3(0,0,5,'red')
4. 证明过程
考虑两张图片,第一张图片上的N个点{Xi|i=1,2..N},对应于第二张图片上的N个点{Yi|i=1,2,...N},其中X,Y均为两维向量。求插值函数使得
插值函数需要使得弯曲能量最小既满足如下条件
.
文献【1】中证明,当插值函数为如下形式时,满足上述条件
对于二维的数据,c为常数,a为两维的向量,X=(x,y),函数向量
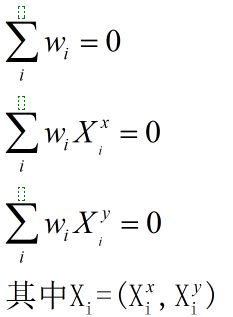
对于N个点,上市只给出了N个约束方程,但是含有N+3个参数,我们添加三个约束
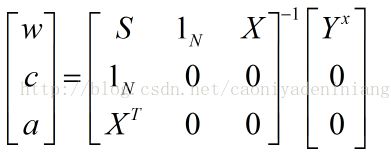
联立上述方程的
解出参数为:
对薄板样条差值的理解不是很深,建议不懂看论文和如下其他博客
【1】Kent, J. T. and Mardia, K. V. (1994a). The link between kriging and thin-plate splines. In: Probability, Statistics and Optimization: a Tribute to Peter Whittle (ed. F. P. Kelly), pp 325–339. John Wiley & Sons, Ltd, Chichester. page 282, 287, 311
【2】http://blog.csdn.net/victoriaw/article/details/70161180
【3】http://blog.csdn.net/iverson_49/article/details/38160081


