Kaggle竞赛 —— 房价预测 (House Prices)
完整代码见kaggle kernel 或 Github
比赛页面:https://www.kaggle.com/c/house-prices-advanced-regression-techniques
这个比赛总的情况就是给你79个特征然后根据这些预测房价 (SalePrice),这其中既有离散型也有连续性特征,而且存在大量的缺失值。不过好在比赛方提供了data_description.txt这个文件,里面对各个特征的含义进行了描述,理解了其中内容后对于大部分缺失值就都能顺利插补了。
参加比赛首先要做的事是了解其评价指标,如果一开始就搞错了到最后可能就白费功夫了-。- House Prices的评估指标是均方根误差 (RMSE),这是常见的用于回归问题的指标 :
我目前的得分是0.11421
对我的分数提升最大的主要有两块:
- 特征工程 : 主要为离散型变量的排序赋值,特征组合和PCA
- 模型融合 : 主要为加权平均和Stacking
将在下文中一一说明。
目录:
- 探索性可视化(Exploratory Visualization)
- 数据清洗(Data Cleaning)
- 特征工程(Feature Engineering)
- 基本建模&评估(Basic Modeling & Evaluation)
- 参数调整(Hyperparameters Tuning)
- 集成方法(Ensemble Methods)
探索性可视化(Exploratory Visualization)
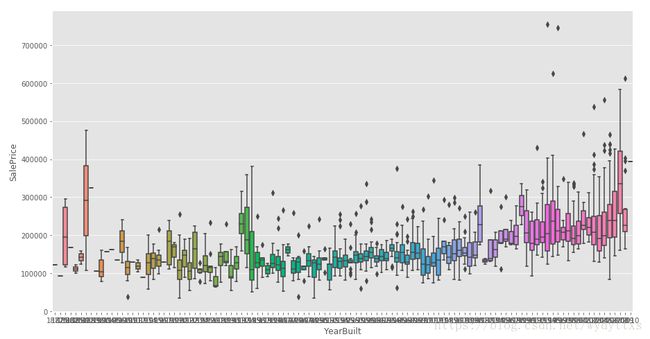
由于原始特征较多,这里只选择建造年份 (YearBuilt) 来进行可视化:
plt.figure(figsize=(15,8))
sns.boxplot(train.YearBuilt, train.SalePrice)
一般认为新房子比较贵,老房子比较便宜,从图上看大致也是这个趋势,由于建造年份 (YearBuilt) 这个特征存在较多的取值 (从1872年到2010年),直接one hot encoding会造成过于稀疏的数据,因此在特征工程中会将其进行数字化编码 (LabelEncoder) 。
数据清洗 (Data Cleaning)
这里主要的工作是处理缺失值,首先来看各特征的缺失值数量:
aa = full.isnull().sum()
aa[aa>0].sort_values(ascending=False)
PoolQC 2908
MiscFeature 2812
Alley 2719
Fence 2346
SalePrice 1459
FireplaceQu 1420
LotFrontage 486
GarageQual 159
GarageCond 159
GarageFinish 159
GarageYrBlt 159
GarageType 157
BsmtExposure 82
BsmtCond 82
BsmtQual 81
BsmtFinType2 80
BsmtFinType1 79
MasVnrType 24
MasVnrArea 23
MSZoning 4
BsmtFullBath 2
BsmtHalfBath 2
Utilities 2
Functional 2
Electrical 1
BsmtUnfSF 1
Exterior1st 1
Exterior2nd 1
TotalBsmtSF 1
GarageCars 1
BsmtFinSF2 1
BsmtFinSF1 1
KitchenQual 1
SaleType 1
GarageArea 1
如果我们仔细观察一下data_description里面的内容的话,会发现很多缺失值都有迹可循,比如上表第一个PoolQC,表示的是游泳池的质量,其值缺失代表的是这个房子本身没有游泳池,因此可以用 “None” 来填补。
下面给出的这些特征都可以用 “None” 来填补:
cols1 = ["PoolQC" , "MiscFeature", "Alley", "Fence", "FireplaceQu", "GarageQual", "GarageCond", "GarageFinish", "GarageYrBlt", "GarageType", "BsmtExposure", "BsmtCond", "BsmtQual", "BsmtFinType2", "BsmtFinType1", "MasVnrType"]
for col in cols1:
    full[col].fillna("None", inplace=True)
下面的这些特征多为表示XX面积,比如 TotalBsmtSF 表示地下室的面积,如果一个房子本身没有地下室,则缺失值就用0来填补。
cols=["MasVnrArea", "BsmtUnfSF", "TotalBsmtSF", "GarageCars", "BsmtFinSF2", "BsmtFinSF1", "GarageArea"]
for col in cols:
    full[col].fillna(0, inplace=True)
LotFrontage这个特征与LotAreaCut和Neighborhood有比较大的关系,所以这里用这两个特征分组后的中位数进行插补。
full['LotFrontage']=full.groupby(['LotAreaCut','Neighborhood'])['LotFrontage'].transform(lambda x: x.fillna(x.median()))
特征工程 (Feature Engineering)
离散型变量的排序赋值
对于离散型特征,一般采用pandas中的get_dummies进行数值化,但在这个比赛中光这样可能还不够,所以下面我采用的方法是按特征进行分组,计算该特征每个取值下SalePrice的平均数和中位数,再以此为基准排序赋值,下面举个例子:
MSSubClass这个特征表示房子的类型,将数据按其分组:
full.groupby(['MSSubClass'])[['SalePrice']].agg(['mean','median','count'])按表中进行排序:
          '180' : 1
          '30' : 2   '45' : 2
          '190' : 3, '50' : 3, '90' : 3,
          '85' : 4, '40' : 4, '160' : 4
          '70' : 5, '20' : 5, '75' : 5, '80' : 5, '150' : 5
          '120': 6, '60' : 6
我总共大致排了20多个特征,具体见完整代码。
特征组合
将原始特征进行组合通常能产生意想不到的效果,然而这个数据集中原始特征有很多,不可能所有都一一组合,所以这里先用Lasso进行特征筛选,选出较重要的一些特征进行组合。
lasso=Lasso(alpha=0.001)
lasso.fit(X_scaled,y_log)
FI_lasso = pd.DataFrame({"Feature Importance":lasso.coef_}, index=data_pipe.columns)

FI_lasso[FI_lasso["Feature Importance"]!=0].sort_values("Feature Importance").plot(kind="barh",figsize=(15,25))
plt.xticks(rotation=90)
plt.show()
最终加了这些特征,这其中也包括了很多其他的各种尝试:
class add_feature(BaseEstimator, TransformerMixin):
    def __init__(self,additional=1):
        self.additional = additional

    def fit(self,X,y=None):
        return self

    def transform(self,X):
        if self.additional==1:
            X["TotalHouse"] = X["TotalBsmtSF"] + X["1stFlrSF"] + X["2ndFlrSF"]
            X["TotalArea"] = X["TotalBsmtSF"] + X["1stFlrSF"] + X["2ndFlrSF"] + X["GarageArea"]

        else:
            X["TotalHouse"] = X["TotalBsmtSF"] + X["1stFlrSF"] + X["2ndFlrSF"]
            X["TotalArea"] = X["TotalBsmtSF"] + X["1stFlrSF"] + X["2ndFlrSF"] + X["GarageArea"]

            X["+_TotalHouse_OverallQual"] = X["TotalHouse"] * X["OverallQual"]
            X["+_GrLivArea_OverallQual"] = X["GrLivArea"] * X["OverallQual"]
            X["+_oMSZoning_TotalHouse"] = X["oMSZoning"] * X["TotalHouse"]
            X["+_oMSZoning_OverallQual"] = X["oMSZoning"] + X["OverallQual"]
            X["+_oMSZoning_YearBuilt"] = X["oMSZoning"] + X["YearBuilt"]
            X["+_oNeighborhood_TotalHouse"] = X["oNeighborhood"] * X["TotalHouse"]
            X["+_oNeighborhood_OverallQual"] = X["oNeighborhood"] + X["OverallQual"]
            X["+_oNeighborhood_YearBuilt"] = X["oNeighborhood"] + X["YearBuilt"]
            X["+_BsmtFinSF1_OverallQual"] = X["BsmtFinSF1"] * X["OverallQual"]

            X["-_oFunctional_TotalHouse"] = X["oFunctional"] * X["TotalHouse"]
            X["-_oFunctional_OverallQual"] = X["oFunctional"] + X["OverallQual"]
            X["-_LotArea_OverallQual"] = X["LotArea"] * X["OverallQual"]
            X["-_TotalHouse_LotArea"] = X["TotalHouse"] + X["LotArea"]
            X["-_oCondition1_TotalHouse"] = X["oCondition1"] * X["TotalHouse"]
            X["-_oCondition1_OverallQual"] = X["oCondition1"] + X["OverallQual"]


            X["Bsmt"] = X["BsmtFinSF1"] + X["BsmtFinSF2"] + X["BsmtUnfSF"]
            X["Rooms"] = X["FullBath"]+X["TotRmsAbvGrd"]
            X["PorchArea"] = X["OpenPorchSF"]+X["EnclosedPorch"]+X["3SsnPorch"]+X["ScreenPorch"]
            X["TotalPlace"] = X["TotalBsmtSF"] + X["1stFlrSF"] + X["2ndFlrSF"] + X["GarageArea"] + X["OpenPorchSF"]+X["EnclosedPorch"]+X["3SsnPorch"]+X["ScreenPorch"]

            return X
PCA
PCA是非常重要的一环,对于最终分数的提升很大。因为我新增的这些特征都是和原始特征高度相关的,这可能导致较强的多重共线性 (Multicollinearity) ,而PCA恰可以去相关性。因为这里使用PCA的目的不是降维,所以 n_components 用了和原来差不多的维度,这是我多方实验的结果,即前面加XX特征,后面再降到XX维。
pca = PCA(n_components=410)

X_scaled=pca.fit_transform(X_scaled)
test_X_scaled = pca.transform(test_X_scaled)
基本建模&评估(Basic Modeling & Evaluation)
首先定义RMSE的交叉验证评估指标:
def rmse_cv(model,X,y):
    rmse = np.sqrt(-cross_val_score(model, X, y, scoring="neg_mean_squared_error", cv=5))
    return rmse
使用了13个算法和5折交叉验证来评估baseline效果:
LinearRegression
Ridge
- Lasso
- Random Forrest
- Gradient Boosting Tree
- Support Vector Regression
- Linear Support Vector Regression
- ElasticNet
- Stochastic Gradient Descent
- BayesianRidge
- KernelRidge
- ExtraTreesRegressor
- XgBoost
names = ["LR", "Ridge", "Lasso", "RF", "GBR", "SVR", "LinSVR", "Ela","SGD","Bay","Ker","Extra","Xgb"]
for name, model in zip(names, models):
    score = rmse_cv(model, X_scaled, y_log)
    print("{}: {:.6f}, {:.4f}".format(name,score.mean(),score.std()))
结果如下, 总的来说树模型普遍不如线性模型,可能还是因为get_dummies后带来的数据稀疏性,不过这些模型都是没调过参的。
LR: 1026870159.526766, 488528070.4534
Ridge: 0.117596, 0.0091
Lasso: 0.121474, 0.0060
RF: 0.140764, 0.0052
GBR: 0.124154, 0.0072
SVR: 0.112727, 0.0047
LinSVR: 0.121564, 0.0081
Ela: 0.111113, 0.0059
SGD: 0.159686, 0.0092
Bay: 0.110577, 0.0060
Ker: 0.109276, 0.0055
Extra: 0.136668, 0.0073
Xgb: 0.126614, 0.0070
接下来建立一个调参的方法,应时刻牢记评估指标是RMSE,所以打印出的分数也要是RMSE。
class grid():
    def __init__(self,model):
        self.model = model

    def grid_get(self,X,y,param_grid):
        grid_search = GridSearchCV(self.model,param_grid,cv=5, scoring="neg_mean_squared_error")
        grid_search.fit(X,y)
        print(grid_search.best_params_, np.sqrt(-grid_search.best_score_))
        grid_search.cv_results_['mean_test_score'] = np.sqrt(-grid_search.cv_results_['mean_test_score'])
        print(pd.DataFrame(grid_search.cv_results_)[['params','mean_test_score','std_test_score']])
举例Lasso的调参:
grid(Lasso()).grid_get(X_scaled,y_log,{'alpha': [0.0004,0.0005,0.0007,0.0006,0.0009,0.0008],'max_iter':[10000]}){'max_iter': 10000, 'alpha': 0.0005} 0.111296607965
params mean_test_score std_test_score
0 {'max_iter': 10000, 'alpha': 0.0003} 0.111869 0.001513
1 {'max_iter': 10000, 'alpha': 0.0002} 0.112745 0.001753
2 {'max_iter': 10000, 'alpha': 0.0004} 0.111463 0.001392
3 {'max_iter': 10000, 'alpha': 0.0005} 0.111297 0.001339
4 {'max_iter': 10000, 'alpha': 0.0007} 0.111538 0.001284
5 {'max_iter': 10000, 'alpha': 0.0006} 0.111359 0.001315
6 {'max_iter': 10000, 'alpha': 0.0009} 0.111915 0.001206
7 {'max_iter': 10000, 'alpha': 0.0008} 0.111706 0.001229经过漫长的多轮测试,最后选择了这六个模型:
lasso = Lasso(alpha=0.0005,max_iter=10000)
ridge = Ridge(alpha=60)
svr = SVR(gamma= 0.0004,kernel='rbf',C=13,epsilon=0.009)
ker = KernelRidge(alpha=0.2 ,kernel='polynomial',degree=3 , coef0=0.8)
ela = ElasticNet(alpha=0.005,l1_ratio=0.08,max_iter=10000)
bay = BayesianRidge()
集成方法 (Ensemble Methods)
加权平均
根据权重对各个模型加权平均:
class AverageWeight(BaseEstimator, RegressorMixin):
    def __init__(self,mod,weight):
        self.mod = mod
        self.weight = weight

    def fit(self,X,y):
        self.models_ = [clone(x) for x in self.mod]
        for model in self.models_:
            model.fit(X,y)
        return self

    def predict(self,X):
        w = list()
        pred = np.array([model.predict(X) for model in self.models_])
        # for every data point, single model prediction times weight, then add them together
        for data in range(pred.shape[1]):
            single = [pred[model,data]*weight for model,weight in zip(range(pred.shape[0]),self.weight)]
            w.append(np.sum(single))
        return w
weight_avg = AverageWeight(mod = [lasso,ridge,svr,ker,ela,bay],weight=[w1,w2,w3,w4,w5,w6])
score = rmse_cv(weight_avg,X_scaled,y_log)
print(score.mean()) # 0.10768459878025885
分数为0.10768,比任何单个模型都好。
然而若只用SVR和Kernel Ridge两个模型,则效果更好,看来是其他几个模型拖后腿了。。
weight_avg = AverageWeight(mod = [svr,ker],weight=[0.5,0.5])
score = rmse_cv(weight_avg,X_scaled,y_log)
print(score.mean())           # 0.10668349587195189
Stacking
Stacking的原理见下图:
如果是像图中那样的两层stacking,则是第一层5个模型,第二层1个元模型。第一层模型的作用是训练得到一个 ℝn×m R n × m 的特征矩阵来用于输入第二层模型训练,其中n为训练数据行数,m为第一层模型个数。
class stacking(BaseEstimator, RegressorMixin, TransformerMixin):
    def __init__(self,mod,meta_model):
        self.mod = mod
        self.meta_model = meta_model
        self.kf = KFold(n_splits=5, random_state=42, shuffle=True)

    def fit(self,X,y):
        self.saved_model = [list() for i in self.mod]
        oof_train = np.zeros((X.shape[0], len(self.mod)))

        for i,model in enumerate(self.mod):
            for train_index, val_index in self.kf.split(X,y):
                renew_model = clone(model)
                renew_model.fit(X[train_index], y[train_index])
                self.saved_model[i].append(renew_model)
                oof_train[val_index,i] = renew_model.predict(X[val_index])

        self.meta_model.fit(oof_train,y)
        return self

    def predict(self,X):
        whole_test = np.column_stack([np.column_stack(model.predict(X) for model in single_model).mean(axis=1)
                                      for single_model in self.saved_model])
        return self.meta_model.predict(whole_test)

    def get_oof(self,X,y,test_X):
        oof = np.zeros((X.shape[0],len(self.mod)))
        test_single = np.zeros((test_X.shape[0],5))
        test_mean = np.zeros((test_X.shape[0],len(self.mod)))
        for i,model in enumerate(self.mod):
            for j, (train_index,val_index) in enumerate(self.kf.split(X,y)):
                clone_model = clone(model)
                clone_model.fit(X[train_index],y[train_index])
                oof[val_index,i] = clone_model.predict(X[val_index])
                test_single[:,j] = clone_model.predict(test_X)
            test_mean[:,i] = test_single.mean(axis=1)
        return oof, test_mean
最开始我用get_oof的方法将第一层模型的特征矩阵提取出来,再和原始特征进行拼接,最后的cv分数下降到了0.1018,然而在leaderboard上的分数却变差了,看来这种方法会导致过拟合。
X_train_stack, X_test_stack = stack_model.get_oof(a,b,test_X_scaled)
X_train_add = np.hstack((a,X_train_stack))
X_test_add = np.hstack((test_X_scaled,X_test_stack))
print(rmse_cv(stack_model,X_train_add,b).mean())    # 0.101824682747
最后的结果提交,我用了Lasso,Ridge,SVR,Kernel Ridge,ElasticNet,BayesianRidge作为第一层模型,Kernel Ridge作为第二层模型。
stack_model = stacking(mod=[lasso,ridge,svr,ker,ela,bay],meta_model=ker)
stack_model.fit(a,b)
pred = np.exp(stack_model.predict(test_X_scaled))

result=pd.DataFrame({'Id':test.Id, 'SalePrice':pred})
result.to_csv("submission.csv",index=False)


