图像质量评估IQA--Jongyoo Kim的三个Image Quality Assessment
或许倒着看效果更好……
1、Deep CNN-Based Blind Image Quality Predictor
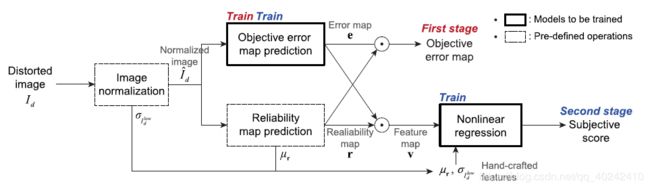
1) predict the objective error map,
Image Normalization:A Gaussian low-pass filter and subsampling (下采样1/4再上采样回去)(原因:低频很难失真,HSV对低频不敏感。)
 ,loss忽视边界4行4列。
ground-truth objective error map:![]() p = 0.2,数据分布大于0。
p = 0.2,数据分布大于0。
根据内容判断预测的Reliability Map Prediction可靠性: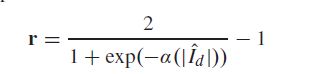 实验a = 1.0最佳。
2) predict subjective score
additional handcrafted features: 归一化后的u和std 。
.
实验:In the experiment with the LIVE IQA database, the patch size was 112 × 112 and each step was 80 × 80.
epoch、Reliability Map(r)、Image Normalization 、Handcrafted Features、Proxy Training Targets(FR第一阶段的学习目标)、Performance on Individual Databases 、 Performance on Individual Distortion Types 、Cross Data Set Test
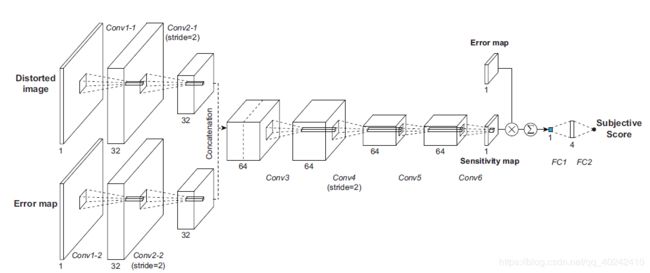
PS:最后提出了一个DIQA-SENS:引入视觉敏感性。distorted image, its objective error map, and its ground-truth subjective score 三个输入,label 是质量分数。即使用第一阶段的网络加一层全连接回归分数得到sensitivity map(中间还有一个相乘)。得到predicts local visual weights of the objective error map (权重)
2、Deep Learning of Human Visual Sensitivity in Image Quality Assessment Framework
感觉上篇的DIQA-SENS可能是这篇的升级版。整体结构也与上篇差不多,但是这篇是FR,或许应该先看这篇的,上篇应该是这篇想法的进化。
a)Image Normalization:灰度图归一化到(0,1)
b)ground-truth objective error map: ,作者称之为sensitivitymap
c)得到sensitivity map后,与下采样1/4的error map矩阵相乘得到P,作者称之为perceptual error map
d)然后 ,两层全连接得到score。
PS:在loss中加了对sensitivity map的L2正则化项,惩罚高频。
实验:正则化项权重,e and sensitivitymap and perceptual error map不同失真和同一失真不同程度的图像对比,结果比对,以及Cross Dataset Test。感觉作者的实验比我的严谨又全面多了。
3、Fully Deep Blind Image Quality Predictor
感觉这篇才是最开始。。。。

惯例开始,发现data数据不足,怎么办呢,patch-wise,又没有patch的label,怎么办呢,研究工作就此展开。
step 1:用SSIM 、GMS 、FSIM and VSI获取patch label作为中间目标。
step 2:在进过1训练的网络上将1扩展到Nm
我觉得我理解的优点偏差,只能贴原文自行体会,,这原文贴的太不容易了。
in Step 1, the CNN is trained for each patch ![]() and regressed onto the local metric score
and regressed onto the local metric score ![]()
In Step 2, the CNN is trained using the patches of an image ![]() and is pooled to the subjective score
and is pooled to the subjective score![]() where Nm is the number of patches in the mth image
where Nm is the number of patches in the mth image
其中,N到2用的是u和std。
实验:Performances comparison(fsim)、1 epoches、4个FR使用比较、Cross dataset test、Effect of patch size、Predicted local metric score visualization等一系列,,太全面了。但是好像最后一个实验才用神奇的MFSIMC,为什么第一个不用呢,,只有图,,不应该有它的结果数据吗,
倒着看其实能get作者的大概想法,一直在寻找中间目标的路上不断探索……