MATLAB教程系列-台大-10 exercise
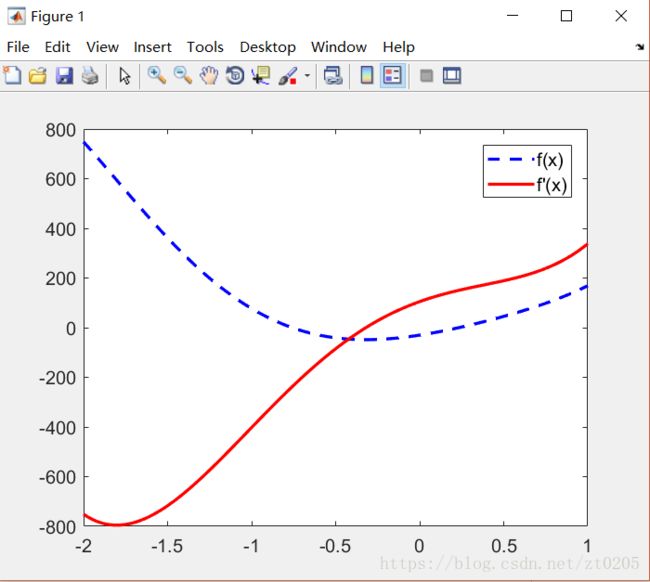
1. 画出多项式函数及其微分的函数图像
题目要求:
代码:
  x = -2:0.01:1;
  f = conv([5 -7 5 10],[4 12 -3]);
  w = polyval(f,x);
  h1 = plot(x,w,'--b');
  set(h1,'Linewidth',2);
  hold on;
  polyder(f);
  n = polyval(polyder(f),x);
  h2 = plot(x,n,'r');
  set(h2,'Linewidth',2);
  hold off;
  legend({'f(x)','f''(x)'},'FontSize',12);
  set(gca,'FontSize',12);
结果:
2. 取不同的h,观察在x0=pi/2处,sin(x)导数的误差
程序:
x0 = pi/2; h=0.1;
num = [];
while h>=0.0000001
    x=[x0 x0+h];
    y=[sin(x0) sin(x0+h)];
    m = diff(y)./diff(x);
    num(end+1) = m;
    h = h/10;
end
结果:
num =
-0.0500 -0.0050 -0.0005 -0.0000 -0.0000 -0.0000 -0.0000
3. 同时画出sin(x)及sin'(x)的图像
代码:
h = 0.2;
hold on;
x = 0:h:2*pi;
y = sin(x);
m = diff(y)./diff(x);
plot(x,y,'b');
plot(x(1:end-1),m,'-or');
hold off;
legend({'sin(x)','sin''(x)'},'FontSize',12);
set(gca,'FontSize',12,'YLim',[-2 2],'XLim',[0,2*pi],'XTick',[0:pi/2:2*pi],'XTickLabel',{'0','π/2','π','3π/2','2π'});
结果:
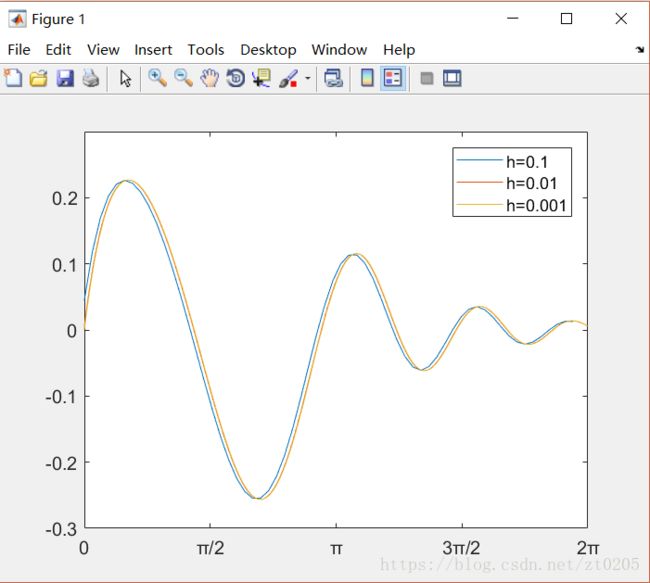
4. 画出某函数在h取得不同精度时的函数图像
代码:
hold on;
h=0.1;
while h>=0.001
x = 0:h:2*pi;
y = exp(-x).*(sin(x.^2/2)); m = diff(y)./diff(x);
plot(x(1:end-1), m);
h= h/10;
end
hold off;
set(gca, 'XLim', [0, 2*pi]); set(gca, 'YLim', [-0.3, 0.3]);
set(gca, 'FontSize', 12);
set(gca,'XTick',[0:pi/2:2*pi],'XTickLabel',{'0','π/2','π','3π/2','2π'});
h = legend('h=0.1','h=0.01','h=0.001');
box on;
结果:


