台湾国立大学郭彦甫Matlab教程笔记(9) basic plotting
台湾国立大学郭彦甫Matlab教程笔记(9)
today:
1.basic plotting
2.graphical objects properties
basics
matlab has a powerful plotting engine that can generate a wide variety of plots
plot from ‘‘data’’
1.matlab does not understand functions f(t)=sin(2pit)
2.strategies:
generate the numetic values
data point
function
plot()
- plot(x,y) plots each vector pairs(x , y)
matlab会 refresh ,把之前的图给清掉,如果 想保留,用 指令 hold on
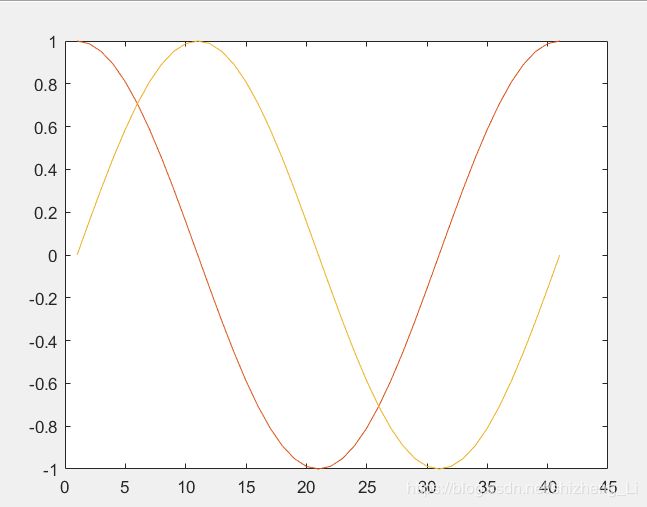
下面是sin和cos的图像
plot(cos(0:pi/20:2*pi));
hold on
 plot(sin(0:pi/20:2*pi));
plot style
plot(x,y,‘str’)plots each vector pairs(x,y ) using the format defined in str (check linespec)
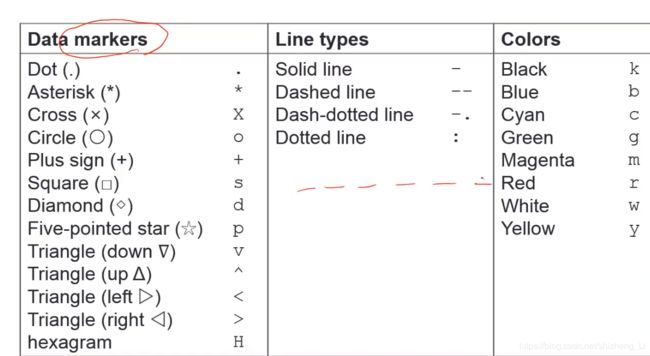
画 marker
如果想要sin函数 用圈圈,显示红色 需要这样添加
plot(sin(0:pi/20:2*pi),'or');
o表示circle圈圈,r表示red红色
如果想要cos函数用叉叉,绿色。则如下:xg
plot(cos(0:pi/20:2*pi),'xg');
legend()函数
add legend to graph 添加图标 legend(‘L1’,‘L2’,‘L3’…)
position adjustment
画图:
x=0:0.5:4*pi;
y=sin(x); h=cos(x); w=1./(1+exp(-x));
g=(1/(2*pi*2)^0.5).*exp((-1.*(x-2*pi).^2)./(2*2^2));
plot(x,y,'bd-',x,h,'gp:',x,w,'ro-',x,g,'c^-');
分析:4个函数,用一个plot画出来。
'bd-'表示:blue diomond solid line 意思是蓝色的,钻石(棱形)的,实线
'gp:'表示: green five-point star dotted line 意思是 绿色的五角星表示的点线
'ro-'表示: red circle solid line 红色的圆圈的实线
'c^-'表示: cyan up triangle solid line 青色,上三角,实线
没有legend的时候 ,

现在为了区分这四个函数,需要添加legend图标
legend('sin(x)','cos(x)','Sigmoid','Causs function');
title() and lable()
title()
xlable()
ylable()
zlable()
例程:
x=0:0.1:2*pi; y1=sin(x); y2=exp(-x);%两个函数
plot(x,y1,'--*',x,y2,':o');%画图
xlabel('t=0 to 2\pi');%x轴
ylabel('values of sin(x) and e^{-x}');%y轴
title('Function plots if sin(x) and e^{-x}');%标题
legend('sin(x)','e^{-x}');%曲线图标
效果:
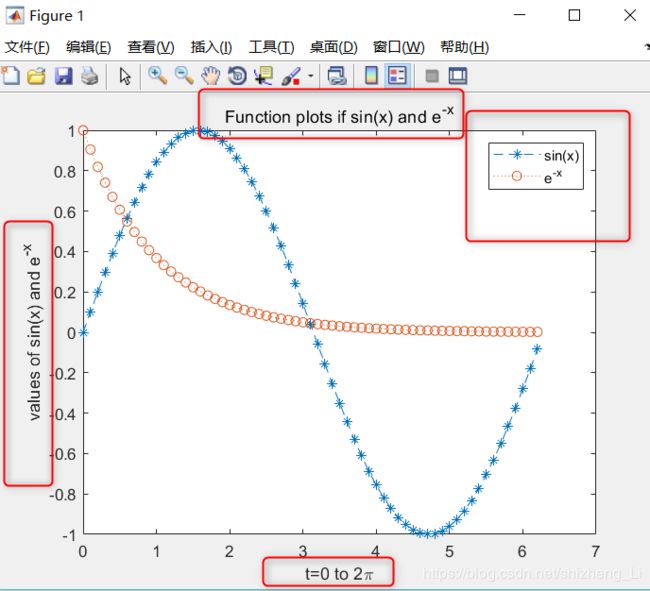 注意:反斜杠\ +pi 这样显示的话 直接是Π ,在字符串里面
text() and annotation()
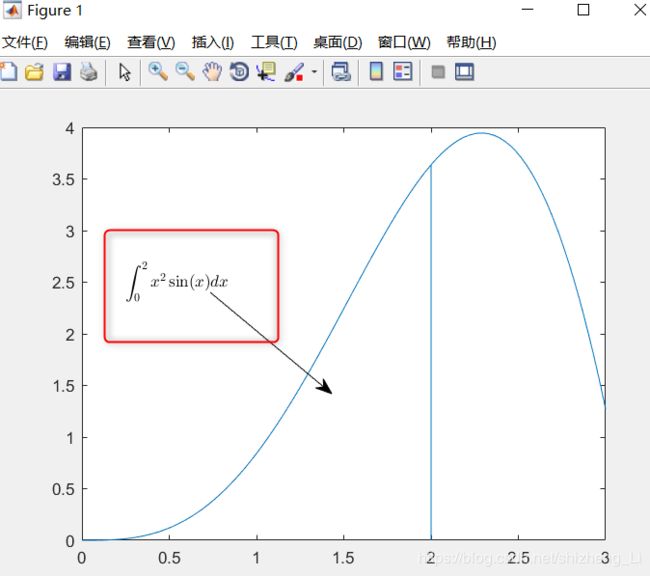
问题:积分符号怎么显示呢?
 text with mathematical expression using Latex
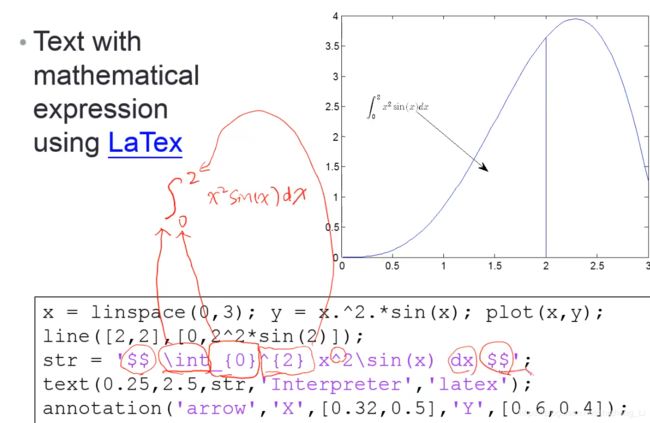 这个积分符号是用text()函数写的 ,text函数前两个参数是坐标,画在哪儿。第三个参数是 积分 这个变量str,后面是一个插值
slash 反斜杠 \int 是∫符号
积分的表示:
str=' $$ \int_ {0}^{2} x^2\sin(x) dx$$';
前后都有两个$$,然后是积分符号,\int_ 然后是上下限 {0}^{2},之后就是一个被积函数 x^2\sin(x) dx
箭头使用annotation 画的 ,arrow, X的位置变化 ,Y的位置变化
代码:
x=linspace(0,3); y=x.^2.*sin(x);plot(x,y);
line([2,2],[0,2^2*sin(2)]);
str=' $$ \int_ {0}^{2} x^2\sin(x) dx$$';
text(0.25,2.5,str,'Interpreter','latex');
annotation('arrow','x',[0.32,0.5],'y',[0.6,0.4]);
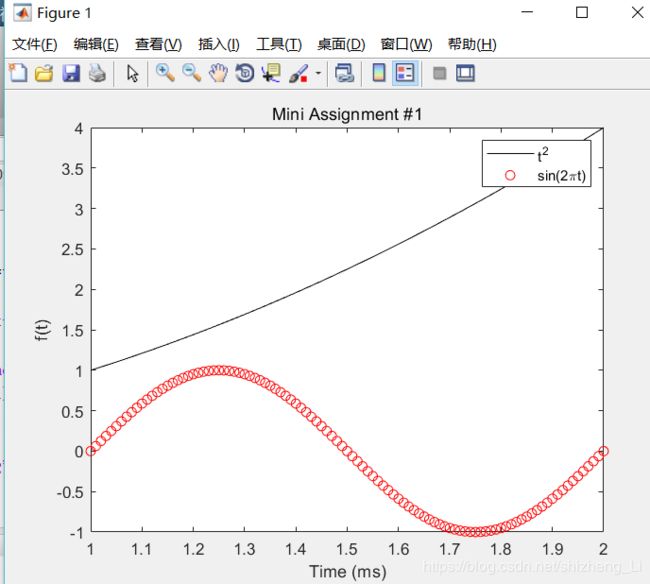
作业题:
t=1:0.01:2;
f=t.*t;
g=sin(2*pi*t);
%画图
plot(t,f,'k-',t,g,'or');
%坐标轴和标题
xlabel('Time (ms)');
ylabel('f(t)');
title('Mini Assignment #1');
%标注函数
legend('t^2','sin(2\pit)');
[总结】
本文记录了基本的绘图知识。主要是text()函数显示积分,还有一些画线的style风格。

