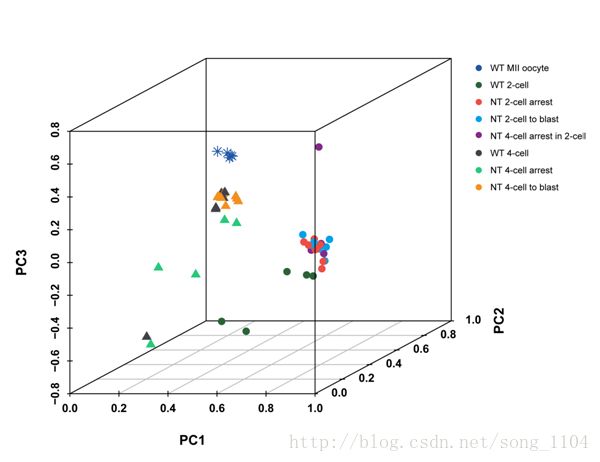
suppressMessages(library(scatterplot3d))
data_3d <- read_xlsx("all genes pca 3d - 副本.xlsx", sheet = 1, col_names = T)
head(data_3d)
data_3d <- data.frame(data_3d)
data_3d$type <- factor(data_3d$type, levels = c("WT MII oocyte", "WT 2-cell", "NT 2-cell arrest", "NT 4-cell arrest in 2 -cell atage", "NT 2-cell to blast", "NT 4-cell arrest", "NT 4-cell to blast", "WT 4-cell"))
mycolour <- c(rep("#2156A6",6), rep("#2B6339",5), rep("#EC4D44", 8), rep("#822A89",6), rep("#00A1E9",8), rep("#27C97B",5),
              rep("#F39020",9), rep("#424248",6))
plot3d <- with(data_3d, scatterplot3d(PC1, PC2, PC3, color = mycolour, pch = c(rep(8,6), rep(16,27), rep(17,20)),
                                      cex.symbols = 1.2, font.lab = 2, font.axis = 2))
legend(plot3d$xyz.convert(1.0,0.8,-0.2),pch=16,yjust=0,legend=levels(data_3d$type), cex = rel(1.1), bty = 'n', xjust = 0.5, horiz = F,
col =("#2156A6","#2B6339","#EC4D44","#822A89","#00A1E9","#27C97B","#F39020","#424248"))

