matlab实现数值分析 的 二次插值+拉格朗日插值
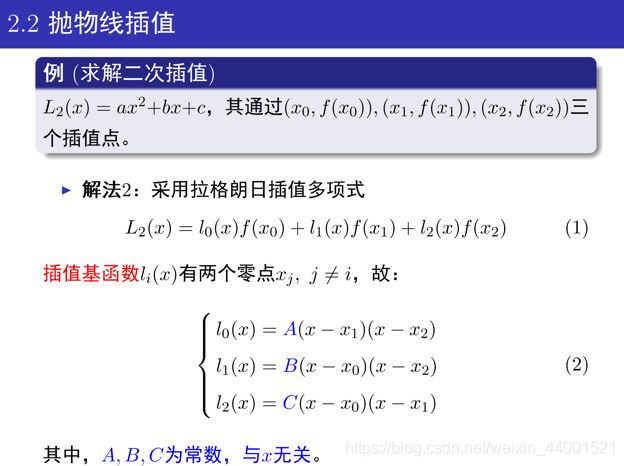
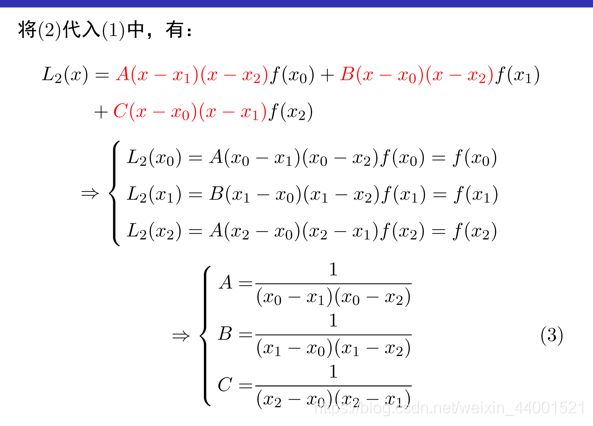
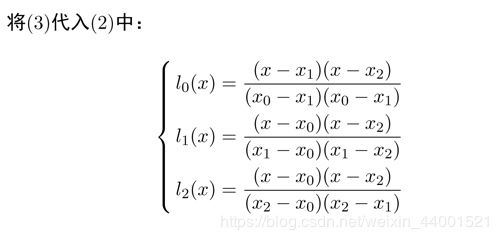
1、二次插值
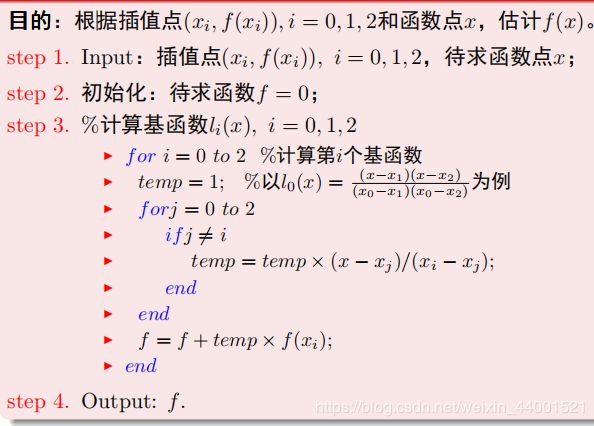
2、matlab代码实现二次插值
% 二次插值--抛物线插值
% x=[-2 0 1 ]
% y=[14 1 3 ]
% plot(x,y,'-')
x=[-2 0 1];
y=[14 1 3];
f=0;
X=1;
for i = 0 :2
    temp =1;
    for j= 0 :2
        if (j ~= i)
            temp= temp * (X-x(j+1))/(x(i+1)-x(j+1))
        end
    end
    f=f+temp *y(i+1);
end
f
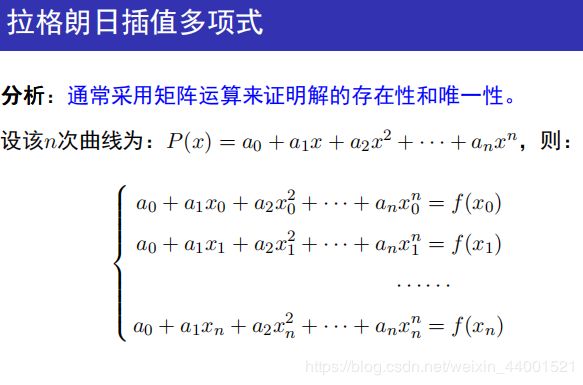
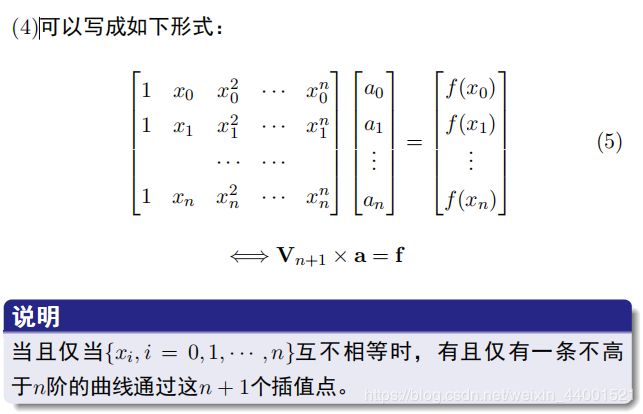
3、拉格朗日插值
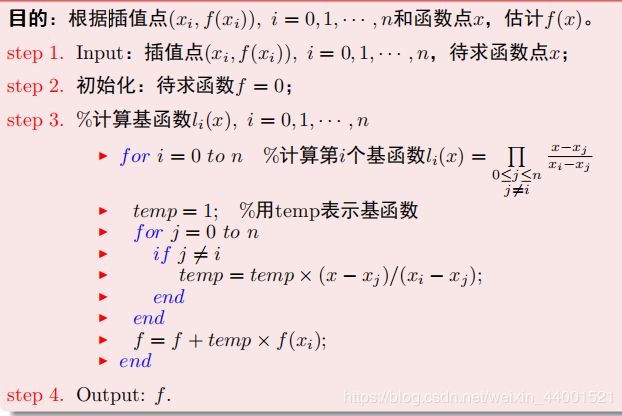
4、matlab代码实现拉格朗日插值
% 拉格朗日插值--n次插值
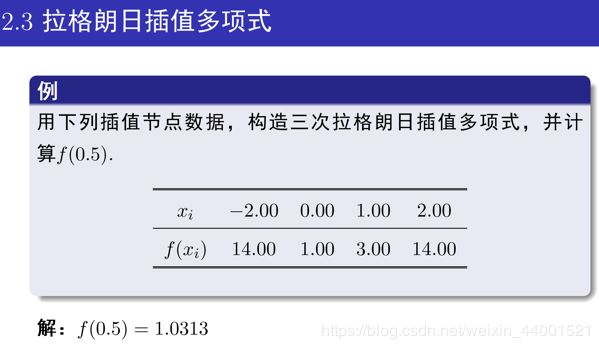
x=[-2 0 1 2];
y=[14 1 3 14];
n=length(x)-1;
X=0.5;
f=0;
for i = 0 :n
    temp =1;
    for j= 0 :n
        if (j ~= i)
            temp= temp * (X-x(j+1))/(x(i+1)-x(j+1))
        end
    end
    f=f+temp *y(i+1);
end
f

%========================后面无关算法

a0=[3.3636   -0.0909    0.4545];
fun=a0(1)*x.*x + a0(2)*x+ a0(3);
F1=a0(1)*X^2 + a0(2)*X+ a0(3);
hold on;
plot(x,fun,'ro-')
hold on;
plot(x,y,'g*-')
hold on;
plot(0.5,f,'ro','MarkerFaceColor','r')
hold on;
plot(0.5,F1,'yo','MarkerFaceColor','y')
legend('拟合的函数','真实点连成函数','目标点','代入拟合函数得到对应的点')
xlabel('自变量值x');
ylabel('因变量值y');
title('拉格朗日插值--n次插值');
grid on;
function f=myfun(a,x)
    f=a(1)*x.*x + a(2)*x+ a(3)
在新建一个.m文件运行下面代码
x=[-2 0 1 2];
y=[14 1 3 14];
a=[0.2,0.05,0.05];
options=statset('MaxIter',100,'TolFun',1e-4,'Display','final');
a=nlinfit(x,y,'myfun',a,options)
f=myfun(a,x)
就可以知道系数为
a0=[3.3636 -0.0909 0.4545];
但是由图像知道,通过几个点不能拟合得到很好的完整的曲线,只能求到某些个点组成的区间函数,但是可以通过插值把整个函数的点拟合出来。
% 返回插值对应的值的矩阵
function Y=Value(X)
x=[-2 0 1 2];
y=[14 1 3 14];
n=length(x)-1;
Y=[];
for z =1:length(X)
    f=0;
    for i = 0 :n
        temp =1;
        for j= 0 :n
            if (j ~= i)
                temp = temp * ( X(z)-x(j+1))/(x(i+1)-x(j+1));
            end
        end
        f=f+temp *y(i+1);
    end
    Y=[Y,f];
end
% 主函数
% 拉格朗日插值--n次插值
clear;clc
x=[-2 0 1 2];
y=[14 1 3 14];
plot(x,y,'b-');
hold on;
Y=[];
X=-2:0.01:2;
Y=Value(X);
plot(X,Y,'r-')
hold on;
图为通过插值再连线得到的曲线,接下来就是模拟这条曲线了。

2种方法:
% 由图像预测图像函数为,f=a(1)*x.*x + a(2)*x+ a(3)
a=[0.2,0.05,0.05];
options=statset('MaxIter',100,'TolFun',1e-4,'Display','final');
a=nlinfit(X,Y,'myfun',a,options);
fun=3.2500 *X.^2  -0.6617  *X + 1.0000;%系数为上面的a矩阵的值
plot(X,fun,'g-')

%由库函数cftool获得最为相似的函数  f =  a(1) + a(2)*cos(x*w) + b1*sin(x*w)
a=[ 14,  -13 ,-1,  0.7 ];
f=myfun(a,X);
b1=a(3);
w=a(4);
f =  a(1) + a(2)*cos(X*w) + b1*sin(X*w);
plot(X,f,'y-')
hold on;
