Kaggle赛题-Synthetic Financial Datasets For Fraud Detection
本文主要通过Kaggle中的Synthetic Financial Datasets For Fraud Detection赛题,即金融反欺诈预测来对数据挖掘的过程进行一个较为全面完整的学习理解。本赛题数据总共有六百多万条,包括了银行对每一笔款项的记录。每条数据包含11个字段,分别为转账时长,款项的事件类型,转出账户的前后余额,转入账户的前后余额,是否为欺诈标签以及银行系统模型的欺诈预判标签。
通过对数据的清洗,整理,可视化展示分析,预处理,特征工程等步骤,最后我们使用逻辑回归LogisticRegression算法对数据
进行二分类预测,通过画出ROC曲线,AUC值等,表明本方法实验效果较好。读者也可以跟着代码记录,一步步的执行,查看结果,如此可对数据分析或者机器学习过程有一个大概的了解,本实验使用的逻辑回归算法理论推导部分可以查看逻辑回归算法理解1和逻辑回归算法理解2两篇文章。
项目URL:https://www.kaggle.com/ntnu-testimon/paysim1
import numpy as np
import pandas as pd
import matplotlib.pyplot as plt

import seaborn as sns
from sklearn import preprocessing
from scipy.stats import skew, boxcox
import os
dataset_path = 'D:\In\kaggle\PS_20174392719_1491204439457_log.csv'
raw_data = pd.read_csv(dataset_path)
# 查看数据集信息
print('数据预览:')
print(raw_data.head())


print('数据统计信息:')
print(raw_data.describe())


print('数据集基本信息:')
print(raw_data.info())

数据预览:
   step      type    amount     nameOrig  oldbalanceOrg  newbalanceOrig  \
0     1   PAYMENT   9839.64  C1231006815       170136.0       160296.36
1     1   PAYMENT   1864.28  C1666544295        21249.0        19384.72
2     1  TRANSFER    181.00  C1305486145          181.0            0.00
3     1  CASH_OUT    181.00   C840083671          181.0            0.00
4     1   PAYMENT  11668.14  C2048537720        41554.0        29885.86

      nameDest  oldbalanceDest  newbalanceDest  isFraud  isFlaggedFraud
0  M1979787155             0.0             0.0        0               0
1  M2044282225             0.0             0.0        0               0
2   C553264065             0.0             0.0        1               0
3    C38997010         21182.0             0.0        1               0
4  M1230701703             0.0             0.0        0               0
数据统计信息:
               step        amount  oldbalanceOrg  newbalanceOrig  \
count  6.362620e+06  6.362620e+06   6.362620e+06    6.362620e+06
mean   2.433972e+02  1.798619e+05   8.338831e+05    8.551137e+05
std    1.423320e+02  6.038582e+05   2.888243e+06    2.924049e+06
min    1.000000e+00  0.000000e+00   0.000000e+00    0.000000e+00
25%    1.560000e+02  1.338957e+04   0.000000e+00    0.000000e+00
50%    2.390000e+02  7.487194e+04   1.420800e+04    0.000000e+00
75%    3.350000e+02  2.087215e+05   1.073152e+05    1.442584e+05
max    7.430000e+02  9.244552e+07   5.958504e+07    4.958504e+07

       oldbalanceDest  newbalanceDest       isFraud  isFlaggedFraud
count    6.362620e+06    6.362620e+06  6.362620e+06    6.362620e+06
mean     1.100702e+06    1.224996e+06  1.290820e-03    2.514687e-06
std      3.399180e+06    3.674129e+06  3.590480e-02    1.585775e-03
min      0.000000e+00    0.000000e+00  0.000000e+00    0.000000e+00
25%      0.000000e+00    0.000000e+00  0.000000e+00    0.000000e+00
50%      1.327057e+05    2.146614e+05  0.000000e+00    0.000000e+00
75%      9.430367e+05    1.111909e+06  0.000000e+00    0.000000e+00
max      3.560159e+08    3.561793e+08  1.000000e+00    1.000000e+00
数据集基本信息:

RangeIndex: 6362620 entries, 0 to 6362619
Data columns (total 11 columns):
step              int64
type              object
amount            float64
nameOrig          object
oldbalanceOrg     float64
newbalanceOrig    float64
nameDest          object
oldbalanceDest    float64
newbalanceDest    float64
isFraud           int64
isFlaggedFraud    int64
dtypes: float64(5), int64(3), object(3)
memory usage: 534.0+ MB
None

print('转账类型记录统计:')
print(raw_data['type'].value_counts())   #type特征列 各转账类型 数量统计

fig, ax = plt.subplots(1, 1, figsize=(8, 4))
raw_data['type'].value_counts().plot(kind='bar', title='Transaction Type', ax=ax, figsize=(8, 4))
plt.show()
转账类型记录统计:
CASH_OUT    2237500
PAYMENT     2151495
CASH_IN     1399284
TRANSFER     532909
DEBIT         41432
Name: type, dtype: int64 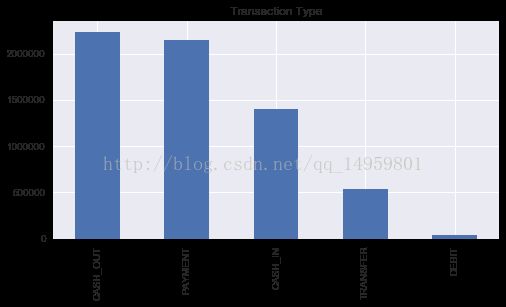
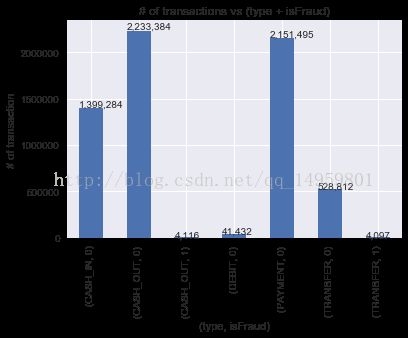
# 查看转账类型和欺诈标记的记录
ax = raw_data.groupby(['type', 'isFraud']).size().plot(kind='bar')   #以type isFraud分组统计 .size()类似pandas的透视表
ax.set_title('# of transactions vs (type + isFraud)')
ax.set_xlabel('(type, isFraud)')
ax.set_ylabel('# of transaction')

# 添加标注
for p in ax.patches:
    ax.annotate(str(format(int(p.get_height()), ',d')), (p.get_x(), p.get_height()*1.01))   #顶部加注释 千分位  注释的xy坐标
plt.show()
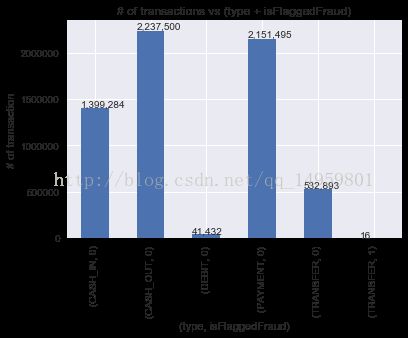
# 查看转账类型和商业模型标记的欺诈记录
ax = raw_data.groupby(['type', 'isFlaggedFraud']).size().plot(kind='bar') #分组统计 每一种type类型中,统计0、1分别有多少个
ax.set_title('# of transactions vs (type + isFlaggedFraud)')
ax.set_xlabel('(type, isFlaggedFraud)')
ax.set_ylabel('# of transaction')
# 添加标注
for p in ax.patches:
ax.annotate(str(format(int(p.get_height()), ',d')), (p.get_x(), p.get_height()*1.01))接下来对数据进行探索性的展现和分析! 不得不说seaborn真的很强大呀!
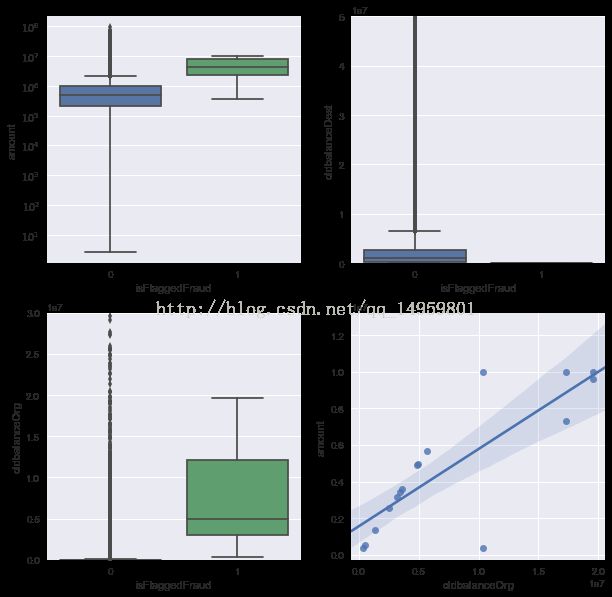
fig, axs = plt.subplots(2, 2, figsize=(10, 10))
transfer_data = raw_data[raw_data['type'] == 'TRANSFER']    #TRANSFER类型是我们重点关注的对象 需要单独拿出来展现、查看、分析!

a = sns.boxplot(x='isFlaggedFraud', y='amount', data=transfer_data, ax=axs[0][0])  #箱图 上下四分位 中位数
axs[0][0].set_yscale('log')   #查看的是转账金额与系统是否标注为欺诈 之间的关系,通过数据可视化发现被标注为欺诈的转账金额往往较高。

b = sns.boxplot(x='isFlaggedFraud', y='oldbalanceDest', data=transfer_data, ax=axs[0][1])  #目标账户原先的余额 系统是否标注为欺诈之间的关系 欺诈的原先账户余额往往较少
axs[0][1].set(ylim=(0, 0.5e8))  # ylim限制y轴的范围

c = sns.boxplot(x='isFlaggedFraud', y='oldbalanceOrg', data=transfer_data, ax=axs[1][0])  #向外转账的账户原先的余额 与系统是否标注为欺诈之间的关系
axs[1][0].set(ylim=(0, 3e7))    #箱图的结果基本符合主观常识

d = sns.regplot(x='oldbalanceOrg', y='amount', data=transfer_data[transfer_data['isFlaggedFraud'] ==1], ax=axs[1][1])#线性关系?原先账户的余额越多转出的就越多?
plt.show()
used_data = raw_data[(raw_data['type'] == 'TRANSFER') | (raw_data['type'] == 'CASH_OUT')] #只保留了行数据TRANSFER 和 CASH_OUT类型
used_data.drop(['step', 'nameOrig', 'nameDest', 'isFlaggedFraud'], axis=1, inplace=True) #丢掉没用的特征数据列
# 重新设置索引
used_data = used_data.reset_index(drop=True)
#将type转换成类别数据,即0, 1
type_label_encoder = preprocessing.LabelEncoder() 数据预处理
type_category = type_label_encoder.fit_transform(used_data['type'].values)
used_data['typeCategory'] = type_category
used_data.head()
type amount oldbalanceOrg newbalanceOrig oldbalanceDest \
0 TRANSFER 181.00 181.0 0.0 0.0
1 CASH_OUT 181.00 181.0 0.0 21182.0
2 CASH_OUT 229133.94 15325.0 0.0 5083.0
3 TRANSFER 215310.30 705.0 0.0 22425.0
4 TRANSFER 311685.89 10835.0 0.0 6267.0
newbalanceDest isFraud typeCategory
0 0.00 1 1
1 0.00 1 0
2 51513.44 0 0
3 0.00 0 1
4 2719172.89 0 1
In [47]: sns.heatmap(used_data.corr()) #不同特征列之间的相关性
Out[47]:
In [48]: plt.show() ax=used_data['type'].value_counts().plot(kind='bar',title="Transaction Type",figsize=(6,6)) #统计各有多少个
...: for p in ax.patches:
...: ax.annotate(str(format(int(p.get_height()),',d')),(p.get_x(),p.get_height()*1.01)) #后面参数为注释所在xy坐标
...: plt.show()ax=pd.value_counts(used_data['isFraud'],sort=True).sort_index().plot(kind='bar',title="Fraud Transaction Count") #统计现在数据中各有多少个
...: for p in ax.patches:
...: ax.annotate(str(format(int(p.get_height()),',d')),(p.get_x(),p.get_height())) 我们发现欺诈和非欺诈数据严重失衡
...: plt.show()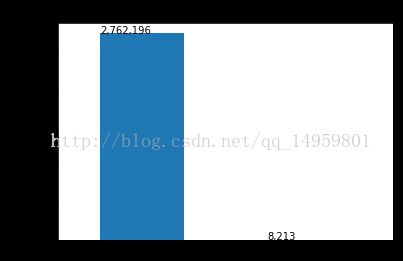
In [61]: xx=pd.value_counts(used_data['isFraud'],sort=True)

In [62]: type(xx)
Out[62]: pandas.core.series.Series

In [63]: xx.head()
Out[63]:
0    2762196
1       8213
Name: isFraud, dtype: int64

In [64]: xx
Out[64]:
0    2762196
1       8213
Name: isFraud, dtype: int64

In [65]: xx=pd.value_counts(used_data['isFraud'],sort=True).sort_index() 加这个sort_index()似乎没变化啊?

In [66]: xx
Out[66]:
0    2762196
1       8213
Name: isFraud, dtype: int64

In [66]:

In [67]: pd.value_counts(used_data['isFraud'])
Out[67]:
0    2762196
1       8213
Name: isFraud, dtype: int64

In [67]: 我们发现正样本的数量相对负样本来说特别少,数据不平衡(这样训练出来的模型只能对负样本有较高的准确率,而正样本的准确率可能很低)所以我们需要降采样,即将负样本减少的跟正样本量差不多


In [68]: feature_names=['amount','oldbalanceOrg','newbalanceOrig','oldbalanceDest','newbalanceDest','typeCategory']
    ...: X=used_data[feature_names]
    ...: Y=used_data['isFraud']
    ...: X.head()
    ...: Y.head()
    ...:
Out[68]:
0    1
1    1
2    0
3    0
4    0
Name: isFraud, dtype: int64

In [69]: X.head()
Out[69]:
      amount  oldbalanceOrg  newbalanceOrig  oldbalanceDest  newbalanceDest  \
0     181.00          181.0             0.0             0.0            0.00
1     181.00          181.0             0.0         21182.0            0.00
2  229133.94        15325.0             0.0          5083.0        51513.44
3  215310.30          705.0             0.0         22425.0            0.00
4  311685.89        10835.0             0.0          6267.0      2719172.89

   typeCategory
0             1
1             0
2             0
3             1
4             1

In [70]: number_records_fraud=len(used_data[used_data['isFraud']==1])

In [71]: number_records_fraud  欺诈数量8213个
Out[71]: 8213

In [72]: xx=used_data['isFraud']==1

In [73]: type(xx)
Out[73]: pandas.core.series.Series

In [74]: xx
Out[74]:
0           True
1           True
2          False
3          False
4          False
5          False
6          False
7          False
8          False
9          False
10         False
11         False
12         False
13         False
14         False
15         False
16         False
17         False
18         False
19         False
20         False
21         False
22         False
23         False
24         False
25         False
26         False
27         False
28         False
29         False
           ...
2770379     True
2770380     True
2770381     True
2770382     True
2770383     True
2770384     True
2770385     True
2770386     True
2770387     True
2770388     True
2770389     True
2770390     True
2770391     True
2770392     True
2770393     True
2770394     True
2770395     True
2770396     True
2770397     True
2770398     True
2770399     True
2770400     True
2770401     True
2770402     True
2770403     True
2770404     True
2770405     True
2770406     True
2770407     True
2770408     True
Name: isFraud, Length: 2770409, dtype: bool

In [75]: fraud_indices=used_data[used_data['isFraud']==1].index.values  #正样本的索引

In [76]: len(fraud_indices)
Out[76]: 8213

In [77]: fraud_indices
Out[77]: array([      0,       1,     123, ..., 2770406, 2770407, 2770408], dtype=int64)#这些索引下的为正样本数据

In [78]: fraud_indices[:5]
Out[78]: array([  0,   1, 123, 124, 192], dtype=int64)

In [79]: nonfraud_indices=used_data[used_data['isFraud']==0].index

In [80]: nonfraud_indices  #负样本的索引
Out[80]:
Int64Index([      2,       3,       4,       5,       6,       7,       8,
                  9,      10,      11,
            ...
            2770103, 2770104, 2770105, 2770106, 2770107, 2770108, 2770109,
            2770110, 2770111, 2770112],
           dtype='int64', length=2762196)

In [81]: random_nonfraud_indices=np.random.choice(nonfraud_indices,number_records_fraud,replace=False)  #在负样本索引当中随机选取8213个索引作为新的负样本!

In [82]: random_nonfraud_indices=np.array(random_nonfraud_indices)   新的负样本索引8213

In [82]:

In [83]: under_sample_indices=np.concatenate([fraud_indices,random_nonfraud_indices])   #新的下采样数据索引!!
    ...: under_sample_data=used_data.iloc[under_sample_indices,:]
    ...:
    ...: X_undersample = under_sample_data[feature_names].values
    ...: y_undersample = under_sample_data['isFraud'].values
    ...:
    ...: # 显示样本比例
    ...: print("非欺诈记录比例: ", len(under_sample_data[under_sample_data['isFraud'] == 0]) / len(under_sample_data))
    ...: print("欺诈记录比例: ", len(under_sample_data[under_sample_data['isFraud'] == 1]) / len(under_sample_data))
    ...: print("欠采样记录数: ", len(under_sample_data))
    ...:
    ...:
非欺诈记录比例:  0.5
欺诈记录比例:  0.5
欠采样记录数:  16426

In [85]: X_train, X_test, y_train, y_test = train_test_split(X_undersample, y_undersample, test_size=0.3, random_state=0)  #7:3拆分
    ...: lr_model = LogisticRegression()
    ...: lr_model.fit(X_train, y_train)
    ...: y_pred_score = lr_model.predict_proba(X_test)
    ...:

In [86]: y_pred_score
Out[86]:
array([[ 0.50192359,  0.49807641],
       [ 0.95716076,  0.04283924],
       [ 0.45924015,  0.54075985],
       ...,
       [ 0.98630318,  0.01369682],
       [ 0.25148841,  0.74851159],
       [ 0.50527488,  0.49472512]])

In [87]: fpr, tpr, thresholds = roc_curve(y_test, y_pred_score[:, 1])    #注意阈值
    ...: roc_auc = auc(fpr,tpr)
    ...: plt.title('Receiver Operating Characteristic')
    ...: plt.plot(fpr, tpr, 'b',label='AUC = %0.2f'% roc_auc)
    ...: plt.legend(loc='lower right')
    ...: plt.plot([0,1],[0,1],'r--')
    ...: plt.xlim([-0.1,1.0])
    ...: plt.ylim([-0.1,1.01])
    ...: plt.ylabel('True Positive Rate')
    ...: plt.xlabel('False Positive Rate')
...: plt.show()AUC值与ROC曲线:准确率越高越好吗?实际上不一定如此,例如100个样本当中有99个负样本,1个正样本,我们能够预测99个负样本,准确率是99%,但正样本预测准确率则为0,所以单看准确率是不够的,由此我们引入了AUC(area under curve)和ROC的概念。AUC值是ROC曲线下的面积,经常作为二分类的结果评价指标!
TP:真阳性,真实值为1,预测值为1
FP:伪阳性,真实值为0,预测值为1
TN:真阴性,真实值为0,预测值为0
FN:伪阴性,真实值为1,预测值为0
TPR代表在所有正样本中,即实际标签为1的样本中,最终被预测为1的比率;
FPR代表在所有负样本中,即实际标签为0的样本中,最终被预测为1的比率;
ROC曲线越靠近左上角,说明正样本更多的被预测为了1,负样本更多的没有被预测为1即更多的被预测为了0,则说明模型的预测效果越好!
ROC曲线上的每一个点对应于一个threshold阈值,对应于一个分类器,每个threshold下会有一个TPR和FPR。比如Threshold最大时,TP=FP=0,对应于原点;Threshold最小时,TN=FN=1,对应于右上角的点(1,1)。随着阈值theta增加,TP和FP都减小,TPR和FPR也减小,ROC点向左下移动;
