Matlab3D画图
文章目录
- 3D线
-
- 1.plot3(x,y,z)
- 2.scatter3(x,y,z)
- 3D面
-
- 3.patch
- surf
- 改变颜色
3D线
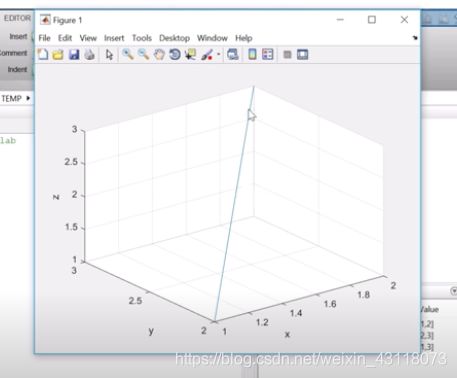
1.plot3(x,y,z)
x = [1 2];
y = [2 3];
z = [1 3];
figure
plot3(x,y,z)
xlabel('x')
ylabel('y')
ylabel('z')
grid on
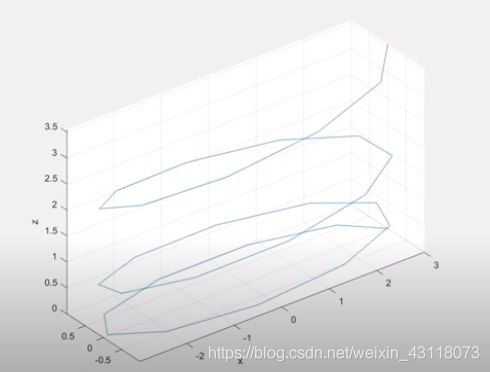
t = linspace(0,6*pi,30);
x = 3*cos(t);
y = 1*sin(t);
z = 0.01*t.^2;
figure
plot3(x,y,z)
xlabel('x')
ylabel('y')
ylabel('z')
grid on
axis('equal')
2.scatter3(x,y,z)
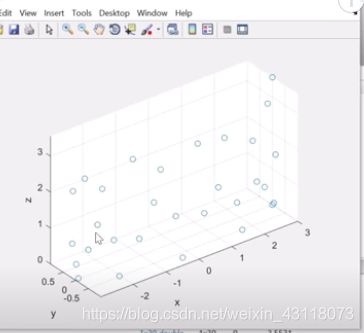
t = linspace(0,6*pi,30);
x = 3*cos(t);
y = 1*sin(t);
z = 0.01*t.^2;
figure
scatter3(x,y,z)
xlabel('x')
ylabel('y')
ylabel('z')
grid on
axis('equal')
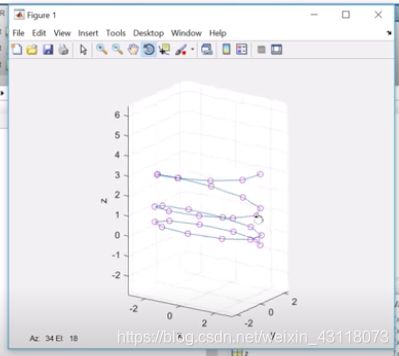
t = linspace(0,6*pi,30);
x = 3*cos(t);
y = 1*sin(t);
z = 0.01*t.^2;
figure
hold on
plot3(x,y,z)
plot3(x,y,z,'mo')
%scatter3(x,y,z)
xlabel('x')
ylabel('y')
ylabel('z')
grid on
axis('equal')
3D面
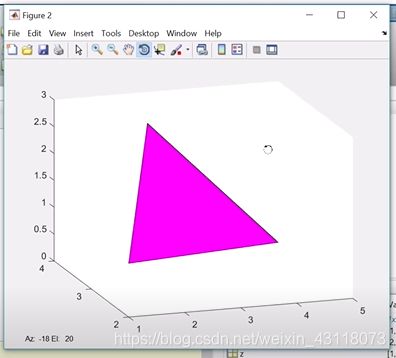
3.patch
%patch
x = [1 2 5]
y = [2 3 4]
z = [1 3 0]
figure
patch(x,y,z,'m')
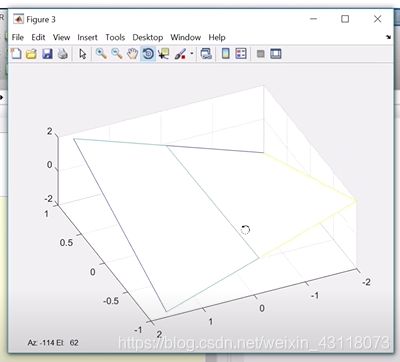
- mesh函数和meshgrid函数
x1 = [-1 1]
x2 = [-2 -0.1 1.7]
%创建一个网格
[X1,X2] = meshgrid(x1,x2);
Z = X1.*X2;
mesh(X1,X2,Z);
x1 = linspace(-pi,pi,20);
x2 = linspace(-10,16,30);
[X1,X2] = meshgrid(x1,x2);
Z = cos(X1).*X2;

figure
mesh(X1,X2,Z);
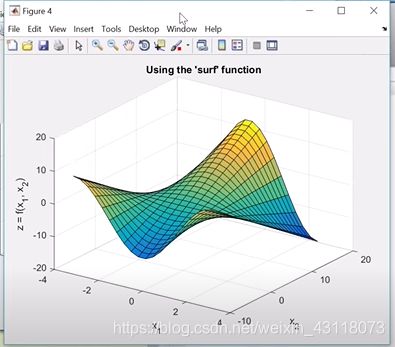
surf
x1 = linspace(-pi,pi,20);
x2 = linspace(-10,16,30);
[X1,X2] = meshgrid(x1,x2);
Z = cos(X1).*X2;

figure
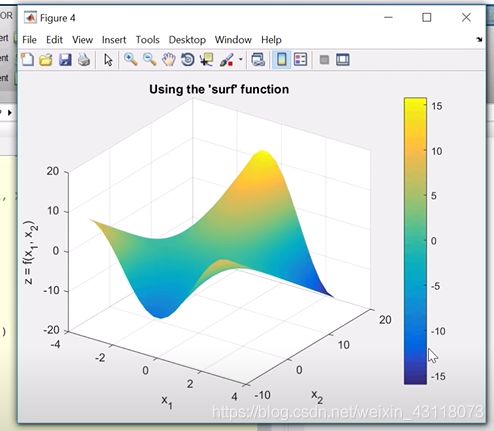
surf(X1,X2,Z);
x1 = linspace(-pi,pi,20);
x2 = linspace(-10,16,30);
[X1,X2] = meshgrid(x1,x2);
Z = cos(X1).*X2;

figure
surf(X1,X2,Z);
xlabel('x_1')
ylabel('x_2')
zlabel('z = f(x_1,x_2)')
grid on
title("Using the "surf" function")
view([35 30])
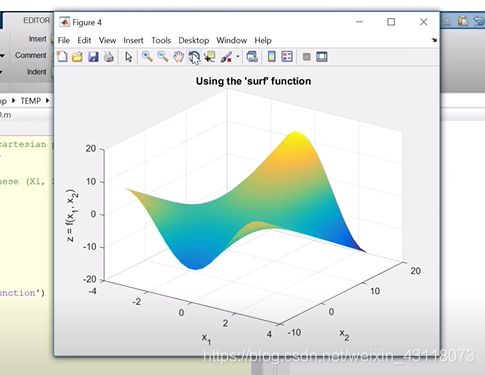
shaing interp %可以消除黑线
- 显示颜色的图例说明
x1 = linspace(-pi,pi,20);
x2 = linspace(-10,16,30);
[X1,X2] = meshgrid(x1,x2);
Z = cos(X1).*X2;

figure
surf(X1,X2,Z);
xlabel('x_1')
ylabel('x_2')
zlabel('z = f(x_1,x_2)')
grid on
title("Using the "surf" function")
view([35 30])
shading interp %可以消除黑线
colorbar %显示图例说明
改变颜色
命令:help colormap
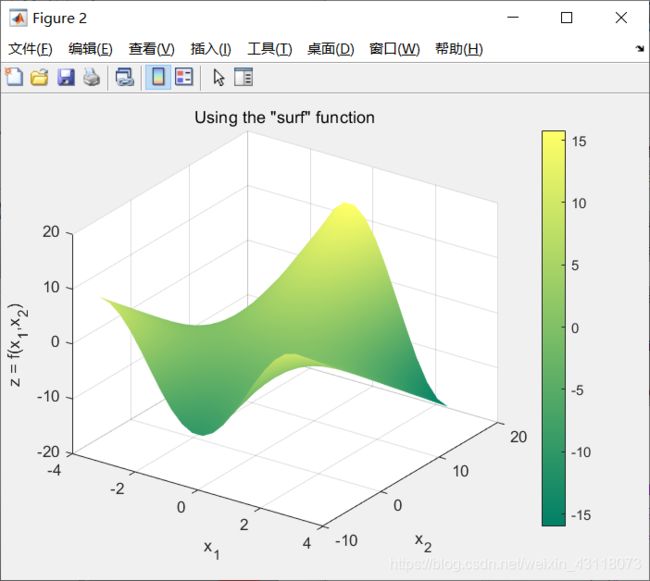
colormap summer
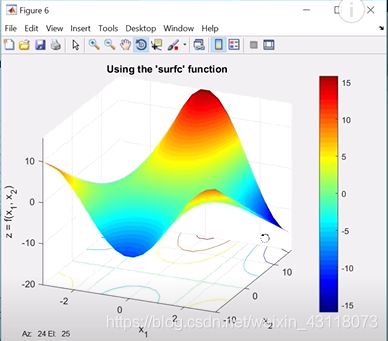
colormap(jet(15));
contour(X1,X2,Z);
contourf(X1,X2,Z);
contourf(X1,X2,Z);
surfc(X1,X2,Z);
surfc(X1,X2,Z);
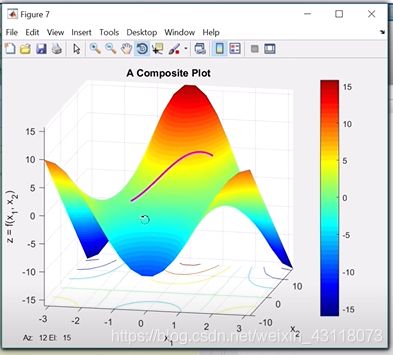
plot3(x1_line,x2_line,z_line,'m','LineWidth',3);
xlabel('x_1');
xlabel('y_1');
xlabel('z = f(x_1,x_2)');
