机器学习 数据预处理之特征缩放(理论+案例)
特征缩放
原因:
- 数量级的差异将导致量级较大的属性占据主导地位
- 数量级的差异将导致迭代收敛速度减慢
- 依赖于样本距离的算法对于数据的数量级非常敏感
好处:
- 提升模型的精度:在机器学习算法的目标函数中使用的许多元素(例如支持向量机的 RBF 内核或线性模型的 l1 和 l2 正则化),都是假设所有的特征都是零均值并且具有同一阶级上的方差。如果某个特征的方差比其他特征大几个数量级,那么它就会在学习算法中占据主导位置,导致学习器并不能像我们期望的那样,从其他特征中学习
- 提升收敛速度:对于线性模型来说,数据归一化后,寻找最优解的过程明显会变得平缓,更容易正确地收敛到最优解
Standardization (Z-score normalization)
通过减去均值然后除以标准差,将数据按比例缩放,使之落入一个小的特定区间,处理后的数据均值为0,标准差为1
x ′ = x − m e a n ( x ) s t d ( x ) x^{\prime} = { {x - mean(x)} \over std(x)} x′=std(x)x−mean(x)
适用范围:
- 数据本身的分布就服从正太分布
- 最大值和最小值未知的情况,或有超出取值范围的离群数据的情况
- 在分类、聚类算法中需要使用距离来度量相似性、或者使用PCA(协方差分析)技术进行降维时,使用该方法表现更好
Rescaling (min-max normalization)
将原始数据线性变换到用户指定的最大-最小值之间,处理后的数据会被压缩到 [0,1] 区间上
x ′ = x − m i n ( x ) m a x ( x ) − m i n ( x ) x^{\prime} = { {x - min(x)} \over {max(x) - min(x)}} x′=max(x)−min(x)x−min(x)
适用范围:
- 对输出范围有要求
- 数据较为稳定,不存在极端的最大最小值
- 在不涉及距离度量、协方差计算、数据不符合正太分布的时候,可以使用该方法
Mean normalization
x ′ = x − m e a n ( x ) m a x ( x ) − m i n ( x ) x^{\prime} = { {x - mean(x)} \over {max(x) - min(x)}} x′=max(x)−min(x)x−mean(x)
Scaling to unit length
将某一特征的模长转化为1
x ′ = x ∣ ∣ x ∣ ∣ x^{\prime} = {x \over ||x||} x′=∣∣x∣∣x
案例
import pandas as pd
import numpy as np
import matplotlib.pyplot as plt
from sklearn import preprocessing
from sklearn.model_selection import train_test_split
from sklearn.decomposition import PCA
from sklearn.naive_bayes import GaussianNB
from sklearn import metrics
%matplotlib inline
df = pd.read_csv(
    'wine_data.csv',  # 葡萄酒数据集
     header=None,     # 自定义列名
     usecols=[0,1,2]  # 返回一个子集
    )
df.columns = ['Class label', 'Alcohol', 'Malic acid'] # 类别标签、酒精、苹果酸
df.head()
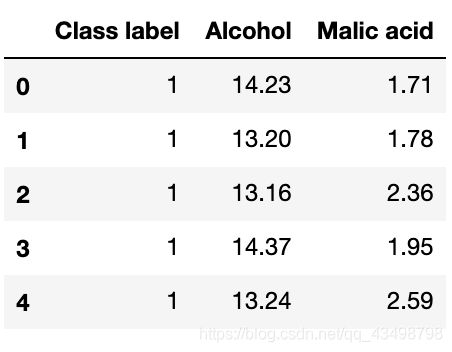
如上表所示,酒精(百分含量/体积含量)和苹果酸(克/升)的测量是在不同的尺度上进行的,因此在对这些数据进行任何比较或组合之前,必须先进行特征缩放
# Standardization
std_scale = preprocessing.StandardScaler().fit(df[['Alcohol', 'Malic acid']])
df_std = std_scale.transform(df[['Alcohol', 'Malic acid']])

# Min-Max scaling
minmax_scale = preprocessing.MinMaxScaler().fit(df[['Alcohol', 'Malic acid']])
df_minmax = minmax_scale.transform(df[['Alcohol', 'Malic acid']])
# 均值、标准差
print('Mean after standardization:\nAlcohol={:.2f}, Malic acid={:.2f}'
      .format(df_std[:,0].mean(), df_std[:,1].mean()))
print('\nStandard deviation after standardization:\nAlcohol={:.2f}, Malic acid={:.2f}'
      .format(df_std[:,0].std(), df_std[:,1].std()))
Mean after standardization:
Alcohol=-0.00, Malic acid=-0.00
Standard deviation after standardization:
Alcohol=1.00, Malic acid=1.00
# 最小值、最大值
print('Min-value after min-max scaling:\nAlcohol={:.2f}, Malic acid={:.2f}'
      .format(df_minmax[:,0].min(), df_minmax[:,1].min()))
print('\nMax-value after min-max scaling:\nAlcohol={:.2f}, Malic acid={:.2f}'
      .format(df_minmax[:,0].max(), df_minmax[:,1].max()))
Min-value after min-max scaling:
Alcohol=0.00, Malic acid=0.00
Max-value after min-max scaling:
Alcohol=1.00, Malic acid=1.00
def plot():
    plt.figure(figsize=(8,6))

    plt.scatter(df['Alcohol'], df['Malic acid'],
            color='green', label='input scale', alpha=0.5)

    plt.scatter(df_std[:,0], df_std[:,1], color='red',
            label='Standardized [$N  (\mu=0, \; \sigma=1)$]', alpha=0.3)

    plt.scatter(df_minmax[:,0], df_minmax[:,1],
            color='blue', label='min-max scaled [min=0, max=1]', alpha=0.3)

    plt.title('Alcohol and Malic Acid content of the wine dataset')
    plt.xlabel('Alcohol')
    plt.ylabel('Malic Acid')
    plt.legend(loc='upper left')
    plt.grid()

    plt.tight_layout()

plot()
plt.show()
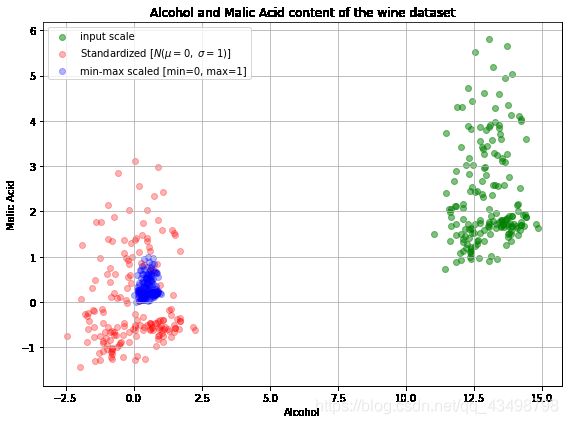
上面的图包括所有三个不同尺度上的葡萄酒数据点:非标准化数据(绿色),z-score标准化后的数据(红色)和max-min标准化后的数据(蓝色)
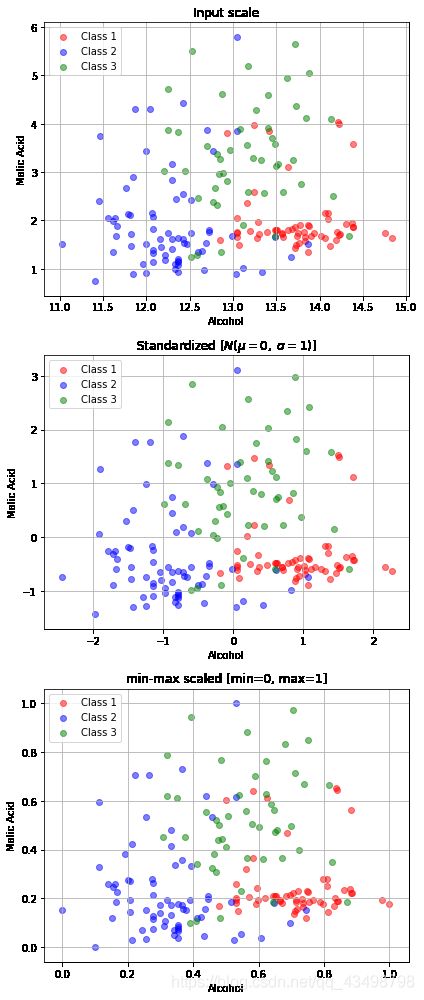
df['Class label'].value_counts().sort_index()
1 59
2 71
3 48
Name: Class label, dtype: int64
fig, ax = plt.subplots(3, figsize=(6,14))

for a,d,l in zip(range(len(ax)),
               (df[['Alcohol', 'Malic acid']].values, df_std, df_minmax),
               ('Input scale',
                'Standardized [$N  (\mu=0, \; \sigma=1)$]',
                'min-max scaled [min=0, max=1]')
                ):
    for i,c in zip(range(1,4), ('red', 'blue', 'green')):
        ax[a].scatter(d[df['Class label'].values == i, 0],
                  d[df['Class label'].values == i, 1],
                  alpha=0.5,
                  color=c,
                  label='Class %s' %i
                  )
    ax[a].set_title(l)
    ax[a].set_xlabel('Alcohol')
    ax[a].set_ylabel('Malic Acid')
    ax[a].legend(loc='upper left')
    ax[a].grid()

plt.tight_layout()
plt.show()
在机器学习中,如果我们对训练集做了上述处理,那么测试集也必须要经过相同的处理
std_scale = preprocessing.StandardScaler().fit(X_train)
X_train = std_scale.transform(X_train)
X_test = std_scale.transform(X_test)
标准化处理对PCA的影响
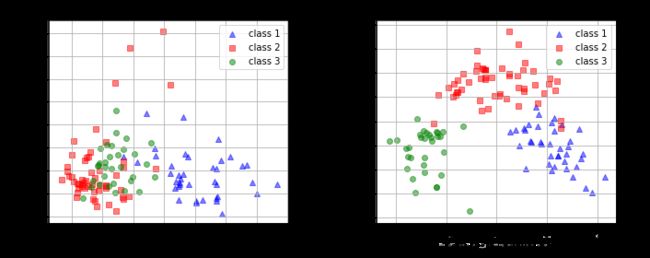
以主成分分析(PCA)为例,标准化是至关重要的,因为它可以分析不同特征的差异
读取数据集
df = pd.read_csv(
    'wine_data.csv',
    header=None,
    )
df.head()
划分训练集和测试集
# 将70%的样本作为训练集,30%作为测试集
X_wine = df.values[:,1:]
y_wine = df.values[:,0]

X_train, X_test, y_train, y_test = train_test_split(X_wine, y_wine,
    test_size=0.30, random_state=12345)
特征缩放
# Standardization
std_scale = preprocessing.StandardScaler().fit(X_train)
X_train_std = std_scale.transform(X_train)
X_test_std = std_scale.transform(X_test)
使用PCA进行降维
对标准化和非标准化数据集执行PCA,将数据集转换为二维特征子空间
# on non-standardized data
pca = PCA(n_components=2).fit(X_train)
X_train = pca.transform(X_train)
X_test = pca.transform(X_test)

# om standardized data
pca_std = PCA(n_components=2).fit(X_train_std)
X_train_std = pca_std.transform(X_train_std)
X_test_std = pca_std.transform(X_test_std)
fig, (ax1, ax2) = plt.subplots(ncols=2, figsize=(10,4))

for l,c,m in zip(range(1,4), ('blue', 'red', 'green'), ('^', 's', 'o')):
    ax1.scatter(X_train[y_train==l, 0], X_train[y_train==l, 1],
        color=c,
        label='class %s' %l,
        alpha=0.5,
        marker=m
        )

for l,c,m in zip(range(1,4), ('blue', 'red', 'green'), ('^', 's', 'o')):
    ax2.scatter(X_train_std[y_train==l, 0], X_train_std[y_train==l, 1],
        color=c,
        label='class %s' %l,
        alpha=0.5,
        marker=m
        )

ax1.set_title('Transformed NON-standardized training dataset after PCA')
ax2.set_title('Transformed standardized training dataset after PCA')

for ax in (ax1, ax2):

    ax.set_xlabel('1st principal component')
    ax.set_ylabel('2nd principal component')
    ax.legend(loc='upper right')
    ax.grid()

plt.tight_layout()
plt.show()
训练朴素的贝叶斯分类器
贝叶斯公式:
p ( w j ∣ x ) = p ( x ∣ w j ) ∗ p ( w j ) p ( x ) p(w_j|x) = { {p(x|w_j) * p(w_j)} \over p(x)} p(wj∣x)=p(x)p(x∣wj)∗p(wj)
# on non-standardized data
gnb = GaussianNB()
fit = gnb.fit(X_train, y_train)

# on standardized data
gnb_std = GaussianNB()
fit_std = gnb_std.fit(X_train_std, y_train)
评估有无标准化的分类准确性
pred_train = gnb.predict(X_train)

print('\nPrediction accuracy for the training dataset')
print('{:.2%}'.format(metrics.accuracy_score(y_train, pred_train)))

pred_test = gnb.predict(X_test)

print('\nPrediction accuracy for the test dataset')
print('{:.2%}\n'.format(metrics.accuracy_score(y_test, pred_test)))
Prediction accuracy for the training dataset
81.45%
Prediction accuracy for the test dataset
64.81%
pred_train_std = gnb_std.predict(X_train_std)

print('\nPrediction accuracy for the training dataset')
print('{:.2%}'.format(metrics.accuracy_score(y_train, pred_train_std)))

pred_test_std = gnb_std.predict(X_test_std)

print('\nPrediction accuracy for the test dataset')
print('{:.2%}\n'.format(metrics.accuracy_score(y_test, pred_test_std)))
Prediction accuracy for the training dataset
96.77%
Prediction accuracy for the test dataset
98.15%
本文到此结束,后续将会不断更新,如果发现上述有误,请各位大佬及时指正!


