从零开始TensorFlow---利用Keras 搭建CNN网络
深度学(xia)习(xue)之Tensorflow
注:本人是深度学习中的一个小菜鸟,更新的目的仅用于记录以及分享自己的掉的坑,如有错误的地方希望大家批评指正(文章不定期更新,请勿攻击,爱你么么哒,废话不多说开搞)
序:
本章是基于tensorflow环境下利用keras 进行搭建简单的深度学习网络模型(大佬请绕行)。
TensorFlow2.0以后的版本中都集成了Keras高级API,仅需要一本Keras手册,我们就可以直接调用已经写好的一些函数,极大的缩减了建立网络所需要的时间,不好的地方就在于其灵活性可能会差一些。重点、重点、重点、敲黑板…在目前TensorFlow中可以直接调用Keras也可以通过tf.keras来调用,但是切忌别混用二者存在不兼容问题,不要雨露均沾,请专一一点,屁话结束开始搞代码。
2 章 基于keras 搭建卷积神经网络
卷积神经网络的发展历程以及相关理论知识请自行学习,下面会基于典型的LENET-5模型建立网络。
(1)数据准备
将自己获得的原始数据通过一些数据处理方式进行加工。
(2)读入处理后的数据
(3)构建模型
(4)创建训练方式
(5)绘制训练的准确率等信息
(6)进行准确率验证
代码如下:
import tensorflow as tf
import scipy.io as scio
from keras.utils import np_utils
import numpy as np
#读取数据
data_path=“XC0.mat”
data=scio.loadmat(data_path)
x_train=data[“train_x”]
x_test=data[“test_x”]
y_train=data[“train_y”]
y_test=data[“test_y”]
#计算数据长度
LR=len(x_train)
LT=len(x_test)
y_train=y_train.reshape(LR).astype(“uint8”)
x_train=x_train.reshape(LR,28,28).astype(“float32”)
y_test=y_test.reshape(LT).astype(“uint8”)
x_test=x_test.reshape(LT,28,28).astype(“float32”)
index=[i for i in range(len(x_train))]
np.random.shuffle(index)#数据打乱处理
x_train=x_train[index]
y_train=y_train[index]
#将数据制成(None,28,28,1)
x_train=x_train.reshape(x_train.shape[0],28,28,1).astype(‘float32’)
x_test=x_test.reshape(x_test.shape[0],28,28,1).astype(‘float32’)
#对数据y做one-hot
y_train_onehot = np_utils.to_categorical(y_train)
y_test_onehot = np_utils.to_categorical(y_test)
#利用Sequential建立模型
from keras.models import Sequential
from keras.layers import Dense,Dropout,Flatten,Conv2D,MaxPooling2D
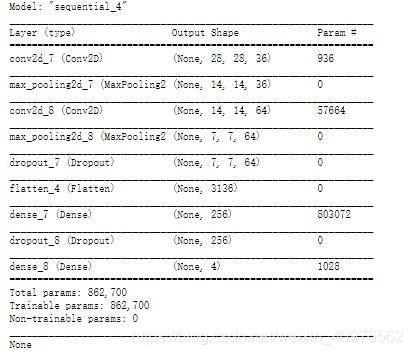
model = Sequential()
model.add(Conv2D(filters=36,
kernel_size=(5,5),
padding=‘same’,
input_shape=(28,28,1),
activation=‘relu’))
model.add(MaxPooling2D(pool_size=(2, 2)))
model.add(Conv2D(filters=64,
kernel_size=(5,5),
padding=‘same’,
activation=‘relu’))
model.add(MaxPooling2D(pool_size=(2, 2)))
model.add(Dropout(0.25))
model.add(Flatten())
model.add(Dense(256, activation=‘relu’))
model.add(Dropout(0.25))
model.add(Dense(4,activation=‘softmax’))
print(model.summary())
 #模型训练
#模型训练
model.compile(loss=‘categorical_crossentropy’,
optimizer=‘adam’,metrics=[‘accuracy’])
train_history=model.fit(x=x_train,
y=y_train_onehot,validation_split=0.2,
epochs=18,batch_size=182,verbose=2)
#导入matplotlib.pyplot并利用history数据进行绘图
import matplotlib.pyplot as plt
def show_train_history(train_acc,test_acc):
plt.plot(train_history.history[train_acc])
plt.plot(train_history.history[test_acc])
plt.title(‘Train History’)
plt.ylabel(‘Accuracy’)
plt.xlabel(‘Epoch’)
plt.legend([‘train’, ‘test’], loc=‘upper left’)
plt.show()
show_train_history(‘accuracy’,‘val_accuracy’)
#利用测试集评估模型准确率
scores = model.evaluate(x_test , y_test_onehot)
scores[1]