线性回归python
Linear regression, one of the basic topics for all who wants to learn statistics. When you start speaking with numbers, they speak in terms of some values. We need to talk to numbers the they way they understand. The more you speak with numbers, more information they give you.
线性回归,这是所有想要学习统计学的人的基本主题之一。 当您开始用数字说话时,他们会说一些值。 我们需要以他们理解的方式来谈论数字。 您说的越多,他们给您的信息就越多。
In this article we will learn what is linear regression, some basic terms with few graphs.
在本文中,我们将学习什么是线性回归,一些基本术语和少量图表。
Few terms:
几个词:
Independent and dependent variables:
自变量和因变量:
The independent variable is the variable the changes or controls and is assumed to have a direct effect on the dependent variable. Two examples of common independent variables are gender and educational level.
自变量是更改或控制的变量,并假定对因变量具有直接影响。 常见的独立变量的两个例子是性别和教育程度。
The dependent variable is the variable being tested and measured in an experiment and is ‘dependent’ on the independent variable. An example of a dependent variable is depression symptoms, which depends on the independent variable (type of therapy).
因变量是在实验中测试和测量的变量,并且“依赖”自变量。 因变量的一个例子是抑郁症状,它取决于自变量(治疗类型)。
Independent and Dependent Variables 独立和因变量Prerequisites for Regression
回归的先决条件
· The dependent variable Y has a linear relationship to the independent variable X.( we can check this by a simple scatter plot)
·因变量Y与自变量X具有线性关系。(我们可以通过简单的散点图进行检查)
· For each value of X, the probability distribution of Y has the same standard deviation σ.
·对于X的每个值,Y的概率分布具有相同的标准偏差σ。
The Least squares Regression Line
最小二乘回归线
Linear regression finds the straight line, called the least squares regression line. The regression line is :
线性回归找到直线,称为最小二乘回归线。 回归线是:
Y=mX+c
Y = mX + c
C= constant
C =常数
M = slope (in a equation of a line, and in regression it is called regression coefficient )
M =斜率(在直线方程中,在回归方程中称为回归系数)
X = independent variable
X =自变量
Y = dependent variable
Y =因变量
Let us study a quick example :
让我们研究一个简单的例子:
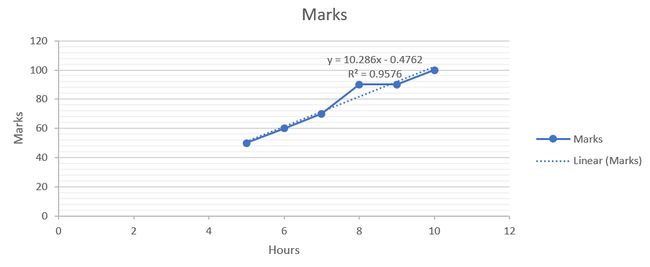
In this above graph , we se the relationship between the marks of a student and hours he spends each day. We see the relationship in perfectly linear. We can see one more term as R square, where we see the value as 1.
在上面的图表中,我们了解了学生的成绩与他每天花费的时间之间的关系。 我们看到这种关系是完全线性的。 我们可以看到另一个项为R square ,其中值为1。
R-squared is a statistical measure of how close the data are to the fitted regression line. It is also known as the coefficient of determination, or the coefficient of multiple determination for multiple regression.
R平方是数据与拟合回归线的接近程度的统计量度。 也称为确定系数,或用于多元回归的多重确定系数。
The definition of R-squared is the percentage of the response variable variation that is explained by a linear model.
R平方的定义是由线性模型解释的响应变量变化的百分比。
R-squared = Explained variation / Total variation
R平方=解释差异/总差异
R-squared is always between 0 and 100%.
R平方始终在0到100%之间。
0% indicates that the model explains none of the variability of the response data around its mean.
0%表示该模型无法解释响应数据均值附近的变异性。
100% indicates that the model explains all the variability of the response data around its mean.
100%表示该模型解释了响应数据均值附近的所有可变性。
Lets see one more example.
让我们再看一个例子。
Linear equation — R square <1 线性方程— R square <1In the above graph, we see the relationship is not perfectly linear. We have tried to make a linear line and tried a good fit. We also see the R square to be 0.95 (95%). This means that the model explains 95% of the variability of the response data around the mean. Or in other words 95% of the variance in Y (marks) is predictable for X ( hours).
在上图中,我们看到该关系不是完全线性的。 我们已经尝试绘制一条直线,并尝试了一个很好的拟合。 我们还看到R平方为0.95(95%)。 这意味着该模型解释了响应数据均值周围95%的变异性。 换句话说,对于X(小时),Y(标记)的方差的95%是可预测的。
Now let us see one more example.
现在让我们再看一个例子。
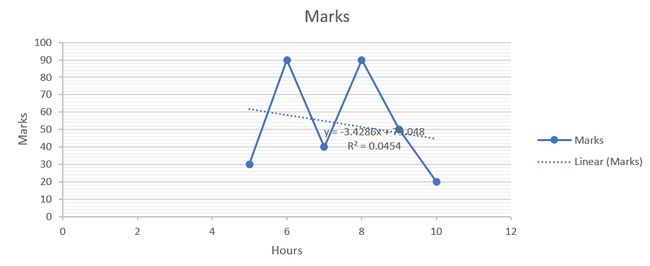
Linear equation R square << 1 线性方程R square << 1In the above example, we see that its very tough to have linear line connecting all data points. The R square value is 0.04 (4%) which is too low to say that the model fits well. Only 10% of the variance in Y (marks) is predictable for X (hours).
在上面的示例中,我们看到很难用线性线连接所有数据点。 R平方值为0.04(4%),该值太低,无法说明该模型拟合得很好。 Y(标记)中只有10%的方差可以预测X(小时)。
Hope with the above examples the interpretability of R square is pretty much clear.
希望通过以上示例,R square的可解释性非常清楚。
Let us solve a simple problem statement:
让我们解决一个简单的问题陈述:
Question: A student uses a regression equation to predict marks, based on hours of study. The correlation between predicted marks and time spent is 0.60. What is the correct interpretation of this finding?
问题:学生根据学习时间使用回归方程预测分数。 预测分数与所花费时间之间的相关性是0.60。 这个发现的正确解释是什么?
Answer: The coefficient of determination measures the proportion of variation in the dependent variable that is predictable from the independent variable. The coefficient of determination is equal to R square ; in this case, (0.60) square or 0.36. Therefore, 36% of the variability in marks can be explained by time spent.
回答:确定系数衡量因变量中可从自变量预测的变化比例。 确定系数等于R平方; 在这种情况下,为(0.60)平方或0.36。 因此,可以通过花费的时间来解释标记变化的36%。
Congratulations, you did it.
恭喜,您做到了。
For now, thank you all for making it this far. We have started with linear regression and its interpretability. We will deep dive further so that we are able to convert a mathematics problem into a simple layman language. One of the most important aspect of any problem statement is that how well u can explain that to business. For this we always need interpretability and explanation in a way that can be easily understood.
现在,谢谢大家所做的一切。 我们从线性回归及其可解释性开始。 我们将进一步深入研究,以便能够将数学问题转换为简单的外行语言。 任何问题陈述中最重要的方面之一是您可以向业务部门解释的程度。 为此,我们始终需要以易于理解的方式进行解释和解释。
If you missed the previous articles on statistics , you can find them here.
如果您错过了以前的统计文章,可以在这里找到它们。
And as always, if there are any question, remarks, or comments feel free to contact me!
和往常一样,如果有任何问题,评论或意见,请随时与我联系!
Reference:
参考:
Statistics How To
统计方法
翻译自: https://medium.com/analytics-vidhya/linear-regression-6577456bdf3c
线性回归python


