机器学习(聚类十)——谱聚类及代码实现
谱聚类是基于谱图理论基础上的一种聚类方法,与传统的聚类方法相比:具有在任意形状的样本空间上聚类并且收敛于全局最优解的优点。(但效率不高,实际工作中用的比较少)
谱聚类
通过对样本数据的拉普拉斯矩阵的特征向量进行聚类,从而达到对样本数据进行聚类的目的;其本质是将聚类问题转换为图的最优划分问题,是一种点对聚类算法。
谱聚类算法将数据集中的每个对象看做图的顶点 V,将顶点间的相似度量化为相应顶点连接边E的权值 w,这样就构成了一个基于相似度的无向加权图 G(V,E),于是聚类问题就转换为图的划分问题。基于图的最优划分规则就是子图内的相似度最大,子图间的相似度最小。
步骤
谱聚类的构建过程主要包含以下几个步骤
- 构建表示对象相似度的矩阵 W
- 构建度矩阵 D(对角矩阵)
- 构建拉普拉斯矩阵 L(有个特点:行累加=0)
- 计算矩阵L的前 k 个特征值的特征向量(k 个列向量)
- 将k个列向量组成矩阵 U ( U n × k ) \quad \left( U_{n×k}\right) (Un×k)
- 对矩阵 U 中的 n 行数据利用 K-means 或其它经典聚类算法进行聚类得出最终结果
拉普拉斯矩阵及变形
W = ( w i j ) i , j = 1 , . . . , n W=(w_{ij}) \quad i,j=1,...,n W=(wij)i,j=1,...,n
D = ( ∑ i = 1 n w 1 j 0 0 0 ⋮ ⋱ ⋮ ⋮ 0 0 ∑ i = 1 n w i j 0 0 0 0 ∑ i = 1 n w n j ) D= \begin{pmatrix} \sum_{i=1}^n w_{1j} & 0 & 0 & 0 \\ \vdots & \ddots & \vdots & \vdots \\ 0 & 0 & \sum_{i=1}^n w_{ij} & 0\\ 0 & 0 & 0 & \sum_{i=1}^n w_{nj} \end{pmatrix} D=⎝⎜⎜⎜⎛∑i=1nw1j⋮000⋱000⋮∑i=1nwij00⋮0∑i=1nwnj⎠⎟⎟⎟⎞
L = D − W L=D-W L=D−W
- 拉普拉斯矩阵(算法默认使用的是拉普拉斯矩阵)
L = D − W L=D-W L=D−W - 对称拉普拉斯矩阵
L s y m = D − 1 2 ( D − W ) D − 1 2 = I − D − 1 2 W D − 1 2 L_{sym}=D^{−\frac{1}{2}} (D−W) D^{−\frac{1}{2}}=I−D^{−\frac{1}{2}} WD^{−\frac{1}{2}} Lsym=D−21(D−W)D−21=I−D−21WD−21 - 随机游走拉普拉斯矩阵
L r w = D − 1 ( D − W ) L_rw=D^{−1} (D−W) Lrw=D−1(D−W)
应用场景
图形聚类、计算机视觉、非凸球形数据聚类等
面临的问题
- 相似度矩阵的构建问题(比较难):业界一般使用高斯相似函数或者k近邻来作为相似度量,一般建议 使用k近邻的方式来计算相似度权值
- 聚类数目的给定
- 如何选择特征向量(矩阵一大,求特征向量的难度会比较高)
- 如何提高谱聚类的执行效率
代码实现
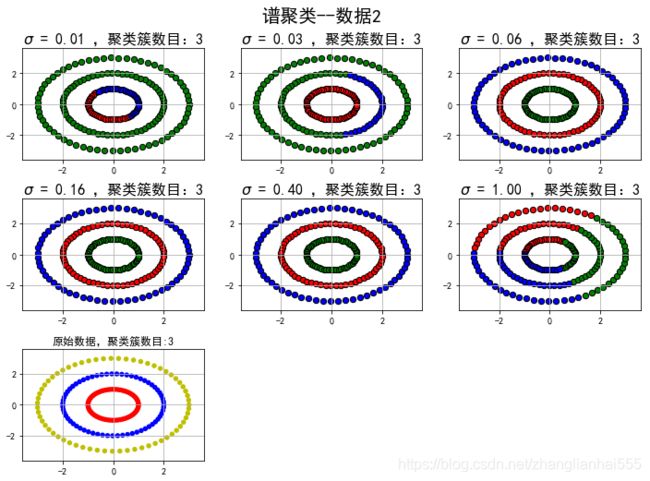
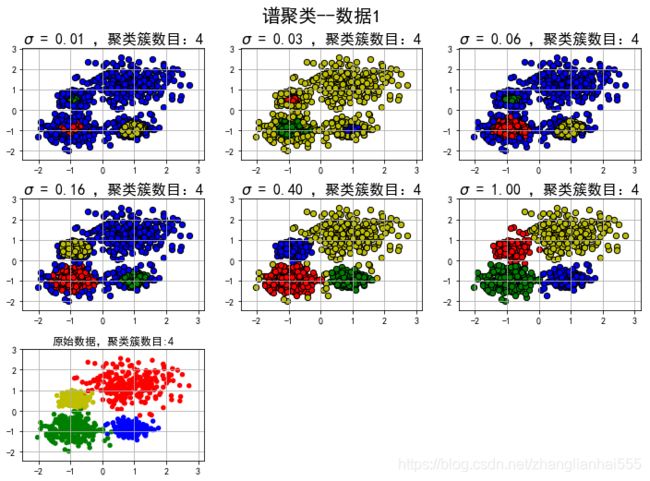
使用scikit的相关API创建模拟数据,然后使用谱聚类算法进行数据聚类操作,并比较算法在不同参数情况下的聚类效果。
API
sklearn.cluster.spectral_clustering(affinity, n_clusters=8, n_components=None, eigen_solver=None, random_state=None, n_init=10, eigen_tol=0.0, assign_labels=‘kmeans’)
参数
- affinity:相似度矩阵构建方式
- assign_labels:上面说的U的构建方式
代码
import numpy as np
import matplotlib as mpl
import matplotlib.pyplot as plt
import sklearn.datasets as ds
import matplotlib.colors
import warnings
from sklearn.cluster import spectral_clustering#引入谱聚类
from sklearn.preprocessing import StandardScaler
from sklearn.metrics import euclidean_distances

## 设置属性防止中文乱码及拦截异常信息
mpl.rcParams['font.sans-serif'] = [u'SimHei']
mpl.rcParams['axes.unicode_minus'] = False

warnings.filterwarnings('ignore', category=FutureWarning)

### 创建模拟数据
N = 1000
centers = [[1, 2], [-1, -1], [1, -1], [-1, 1]]
#符合高斯分布的数据集
data1, y1 = ds.make_blobs(N, n_features=2, centers=centers, cluster_std=(0.75,0.5,0.3,0.25), random_state=0)
data1 = StandardScaler().fit_transform(data1)
dist1 = euclidean_distances(data1, squared=True)
# 权重计算公式
affinity_params1 = map(lambda x: (x,np.exp(-dist1 ** 2 / (x ** 2)) + 1e-6), np.logspace(-2,0,6))

# 数据2
#圆形数据集
t = np.arange(0, 2 * np.pi, 0.1)
data2_1 = np.vstack((np.cos(t), np.sin(t))).T
data2_2 = np.vstack((2*np.cos(t), 2*np.sin(t))).T
data2_3 = np.vstack((3*np.cos(t), 3*np.sin(t))).T
data2 = np.vstack((data2_1, data2_2, data2_3))
y2 = np.vstack(([0] * len(data2_1), [1] * len(data2_2), [2] * len(data2_3)))
## 数据2的参数
dist2 = euclidean_distances(data2, squared=True)
affinity_params2 = map(lambda x: (x, np.exp(-dist2 ** 2 / (x ** 2)) + 1e-6), np.logspace(-2,0,6))

datasets = [(data1, y1, affinity_params1), (data2, y2, affinity_params2)]

def expandBorder(a, b):
    d = (b - a) * 0.1
    return a-d, b+d
colors = ['r', 'g', 'b', 'y']
cm = mpl.colors.ListedColormap(colors)

for i,(X, y, params) in enumerate(datasets):
    x1_min, x2_min = np.min(X, axis=0)
    x1_max, x2_max = np.max(X, axis=0)
    x1_min, x1_max = expandBorder(x1_min, x1_max)
    x2_min, x2_max = expandBorder(x2_min, x2_max)
    n_clusters = len(np.unique(y))
    plt.figure(figsize=(12, 8), facecolor='w')
    plt.suptitle(u'谱聚类--数据%d' % (i+1), fontsize=20)
    plt.subplots_adjust(top=0.9,hspace=0.35)

    for j,param in enumerate(params):
        sigma,af = param
        #谱聚类的建模
        ## af: 指定相似度矩阵构造方式(就是相似度矩阵)
        y_hat = spectral_clustering(af, n_clusters=n_clusters, assign_labels='kmeans', random_state=28)
        unique_y_hat = np.unique(y_hat)
        n_clusters = len(unique_y_hat) - (1 if -1 in y_hat else 0)
        print ("类别:",unique_y_hat,";聚类簇数目:",n_clusters)

        ## 开始画图
        plt.subplot(3,3,j+1)
        for k, col in zip(unique_y_hat, colors):
            cur = (y_hat == k)
            plt.scatter(X[cur, 0], X[cur, 1], s=40, c=col, edgecolors='k')
        plt.xlim((x1_min, x1_max))
        plt.ylim((x2_min, x2_max))
        plt.grid(True)
        plt.title('$\sigma$ = %.2f ,聚类簇数目:%d' % (sigma, n_clusters), fontsize=16)

    plt.subplot(3,3,7)
    plt.scatter(X[:, 0], X[:, 1], c=y, s=30, cmap=cm, edgecolors='none')
    plt.xlim((x1_min, x1_max))
    plt.ylim((x2_min, x2_max))
    plt.title('原始数据,聚类簇数目:%d' % len(np.unique(y)))
    plt.grid(True)
    plt.show()
类别: [0 1 2 3] ;聚类簇数目: 4
类别: [0 1 2 3] ;聚类簇数目: 4
类别: [0 1 2 3] ;聚类簇数目: 4
类别: [0 1 2 3] ;聚类簇数目: 4
类别: [0 1 2 3] ;聚类簇数目: 4
类别: [0 1 2 3] ;聚类簇数目: 4
类别: [0 1 2] ;聚类簇数目: 3
类别: [0 1 2] ;聚类簇数目: 3
类别: [0 1 2] ;聚类簇数目: 3
类别: [0 1 2] ;聚类簇数目: 3
类别: [0 1 2] ;聚类簇数目: 3
类别: [0 1 2] ;聚类簇数目: 3

上面提到“affinity:相似度矩阵构建方式”,可以使用高斯(相似度矩阵的构建问题,业界一般使用高斯相似函数或者k近邻来作为相似度量。)σ是高斯相似函数中的值
