【深度学习】classification_report
classification_report() 是python在机器学习中常用的输出模型评估报告的方法。
注意!!classification_report(y_true, y_pred)中,y_true, y_pred的先后顺序不能变,一定要真实label在前,预测值在后。否则计算出的precision&recall两列的值是相反的,踩坑+++。
主要参数:
y_true:1维数组,或标签指示器数组/稀疏矩阵,目标值。
y_pred:1维数组,或标签指示器数组/稀疏矩阵,分类器返回的估计值。
labels:array,shape = [n_labels],报表中包含的标签索引的可选列表。
target_names:字符串列表,与标签匹配的可选显示名称(相同顺序)。
sample_weight:类似于shape = [n_samples]的数组,可选项,样本权重。
digits:int,输出浮点值的位数。
from sklearn.metrics import classification_report


# 测试集真实数据
y_test =      [1, 2, 3, 1, 2, 3, 1, 2, 3]
# 预测结果
y_predicted = [1, 2, 3, 3, 2, 1, 3, 2, 3]


# 2次1标签,成功1次,1标签预测的准确率率为0.5
# 3次2标签,成功3次,2标签预测的准确率为1.0
# 4次3标签,成功2次,3标签预测的准确率为0.5

print(classification_report(y_test, y_predicted))
print(classification_report(y_test, y_predicted, target_names=['a类', 'b类', 'c类']))
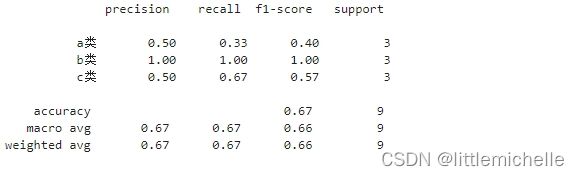
其中列表左边的一列为分类的标签名,右边support列为每个标签的出现次数.avg / total行为各列的均值(support列为总和)。
模型评估指标micro avg、macro avg和weighted avg的计算方式及区别_山阴少年的博客-CSDN博客
metrics.classification_report函数记录 - tianyunzqs的文章 - 知乎
- accuracy:
- macro avg:maro avg的中文名称为
宏平均,其计算方式为每个类型的P、R的算术平均,上栗,(0.4+1+0.57)/3=0.65666 - weighted avg: weighted avg的计算方式与micro avg很相似,只不过weighted avg是用每一个类别样本数量在所有类别的样本总数的占比作为权重。上栗,(3/9)*0.4+(3/9)*1+(3/9)*0.57=
注意这个target_names, 数量要与y_pred,y_true中类别数保持一致,否则,
ValueError: Number of classes, 3, does not match size of target_names, 4. Try specifying the labels parameter
classification_report(y_test, y_predicted, target_names={'a类':0, 'b类':1, 'c类':2, 'd类':3})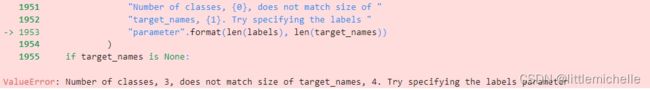
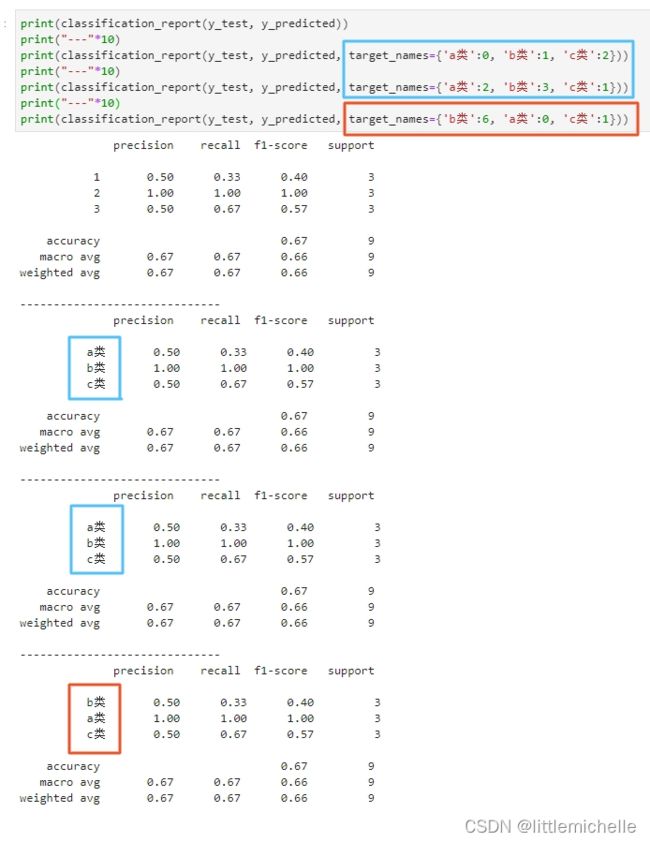
另外, target_names完全是按照顺序进行赋值的,我原本以为是按照索引下标赋值。但是我将
{'a类':0, 'b类':1, 'c类':2} 改为 {'a类':2, 'b类':3, 'c类':1},蓝框没任何变化。但是改了a类、b类的顺序,红框发生了变化。
将 classification_report 导出为csv,便于进一步分析。
report = classification_report(y_test_cid3_top1, y_true_cid3_top1,output_dict=True)
df = pd.DataFrame(report).transpose()
df_new = df.reset_index() # 需要将index列单独保存下来。当做新的一列。
# index 是label id
df.to_csv("precision_recall_result.csv", index=True, sep='\t')
df_new.to_csv("label_precision_recall_result.csv", index=True, sep='\t') 
precision & recall 再次计算
from sklearn.metrics import classification_report
y_true = [0, 1, 2, 2, 2]
y_pred = [0, 0, 2, 2, 1]
print(classification_report(y_true, y_pred))

# recall的分母是原样本, y_true = [0, 1, 2, 2, 2]
# 对于label=0,真实=0的有1个,对应成功的有1个,recall=1
# 对于label=2, 真实=2的有3个,且对应成功的有3个,recall=2/3=0.67
# 对于label=1, 真实=1的有1个,且对应成功的有0个,recall=0/1=0

# precision的分母是预测值, y_pred = [0, 0, 2, 2, 1]
# 对于label=0,预测=0的有2个,对应真实的有1个,precision=1/2=0.5
# 对于label=2, 预测=2的有2个,对应真实的有2个,precision=2/2=1
# 对于label=1, 预测=1的有1个,对应真实的有0个,precision=0/1=0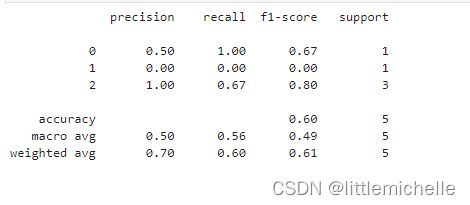
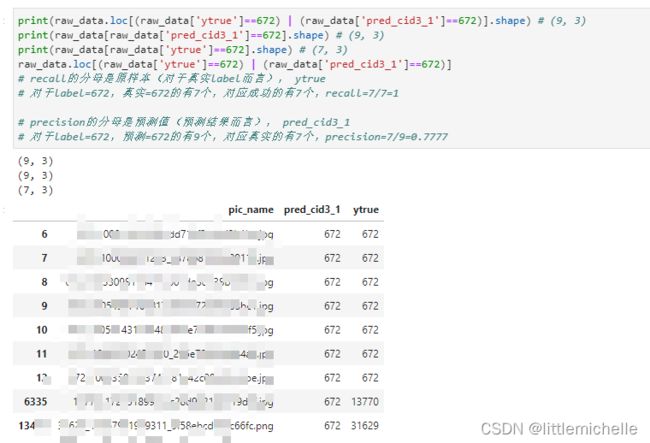
具体例子再算一遍


参考
metrics.classification_report函数记录 - tianyunzqs的文章 - 知乎
机器学习笔记--classification_report&精确度/召回率/F1值_classification_report的召回率应该高还是低_阿卡蒂奥的博客-CSDN博客