图像处理之Hough变换检测直线
hough变换-直线检测
- 一、 前言
- 二、Hough 变换
- 三、直线检测
- 四、代码实现
-
- 1.hough检测
- 2.画直线代码
- 3.画hough空间代码
- 4.检测结果
一、 前言
霍夫变换是一种特征检测(feature extraction),被广泛应用在图像分析(image analysis)、计算机视觉(computer vision)以及数位影像处理(digital image processing)。由RichardDuda和PeterHart在公元1972年发明,并称之为广义霍夫变换(generalizedHoughtransform),广义霍夫变换和更早前1962年的PaulHough的专利有关。经典的霍夫变换是侦测图片中的直线,之后,霍夫变换不仅能识别直线,也能够识别任何形状,常见的有圆形、椭圆形。1981年,因为DanaH.Ballard的一篇期刊论文"Generalizing the Hough transform to detect arbitrary shapes",让霍夫变换开始流行于计算机视觉界。霍夫变换是用来辨别找出物件中的特征,例如:线条。他的算法流程大致如下,给定一个物件、要辨别的形状的种类,算法会在参数空间(parameter space)中执行投票来决定物体的形状,而这是由累加空间(accumulator space)里的局部最大值(local maximum)来决定。
二、Hough 变换
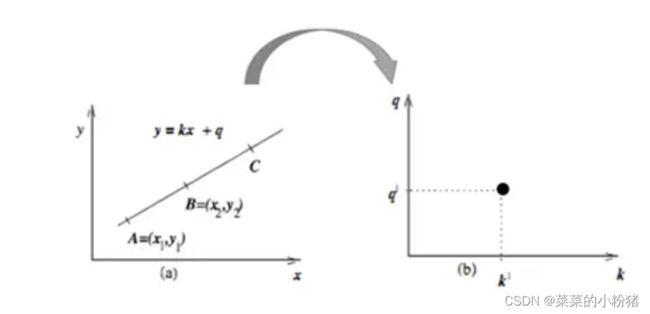
一条直线可由两个点 A = ( x 1 , y 1 ) A=(x_1,y_1) A=(x1,y1)和 B = ( x 2 , y 2 ) B=(x_2,y_2) B=(x2,y2)确定(笛卡尔坐标)

另一方面, y = k x + b y=kx+b y=kx+b也可以写成关于 ( k , q ) (k,q) (k,q)的函数表达式(霍夫空间):
{ q = − k x 1 + y 1 q = − k x 2 + y 2 \left\{ \begin{aligned} q=-kx_1+y_1 \\ q=-kx_2+y_2 \\ \end{aligned} \right. {q=−kx1+y1q=−kx2+y2
空间变换过程如下图:
变换后的空间成为霍夫空间。即:笛卡尔坐标系中一条直线,对应霍夫空间的一个点。
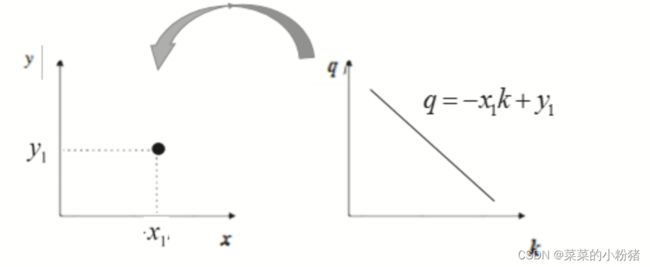
反过来同样成立(霍夫空间的一条直线,对应笛卡尔坐标系的一个点):
笛卡尔坐标系中两个点对应霍夫空间两条线:
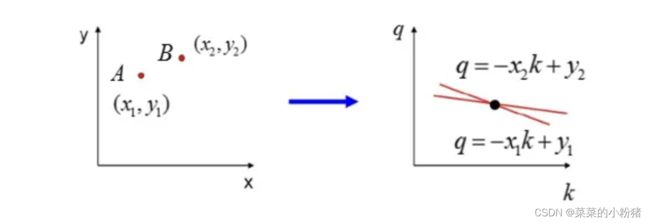
如果笛卡尔坐标系三个点共线,对应的霍夫空间的三条线相交于一点

霍夫变换的后处理的基本方式:选择由尽可能多直线汇成的点。
但是,按照直角坐标系表示的话会出现下图的情况:当图像空间中点共的线垂直于x轴时,斜率无限大,在霍夫空间无法找到交点。因而,人们最终引入了极坐标的表示法。

极坐标下的霍夫直线检测原理与直角坐标系下完全一致,唯一需要重新推导的是与霍夫空间的极坐标参数函数:
y = ( − c o s θ s i n θ ) x + r s i n θ y=\left(-\frac{cos\theta}{sin\theta}\right)x+\frac{r}{sin\theta} y=(−sinθcosθ)x+sinθr
化简便可得到:
r = x c o s θ + y s i n θ r=xcos\theta+ysin\theta r=xcosθ+ysinθ
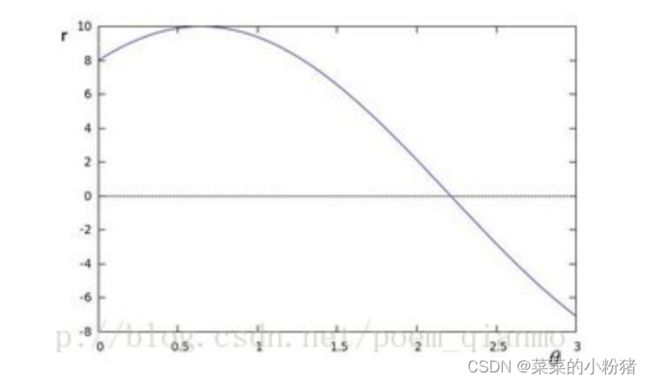
如果对于一个给定点 ( x 0 , y 0 ) (x_0,y_0) (x0,y0),意味着每一对 ( r , θ ) (r,\theta) (r,θ)代表一条通过点 ( x θ , y θ ) (x_\theta,y_\theta) (xθ,yθ)的直线。我们在极坐标对极径极角平面绘出所有通过它的直线, 将得到一条正弦曲线. 例如, 对于给定点 ( x 0 = 8 和 y 0 = 6 ) (x_0= 8 和y_0= 6) (x0=8和y0=6) 我们可以绘出下图 (在平面):
极坐标与笛卡尔坐标的转换公式,从极坐标转换 ( r , θ ) (r,θ) (r,θ)在笛卡尔坐标系 ( x , y ) (x,y) (x,y):
{ x = r c o s θ y = r s i n θ \left\{ \begin{aligned} x=rcos\theta \\ y=rsin\theta \\ \end{aligned} \right. {x=rcosθy=rsinθ
从笛卡儿坐标转换 ( x , y ) (x,y) (x,y) 到极坐标 ( r , θ ) (r,θ) (r,θ):
r = x 2 + y 2 θ = a r c t a n ( y / x ) r=\sqrt{x^2+y^2} \\ \theta=arctan(y/x) r=x2+y2θ=arctan(y/x)
在极坐标系下,其实是一样的:极坐标的点→霍夫空间的直线,只不过霍夫空间不再是 [ k , q ] [k,q] [k,q]的参数,而是 ( r , θ ) (r,\theta) (r,θ)。
三、直线检测
通过上面的介绍可知,画出 x − y x-y x−y坐标空间中的点在参数空间中对应的曲线,然后计算参数空间中曲线的交点,就能求得待求的参数。但还有一个问题,当参数空间中的曲线存在多个交点时,如何挑选出最有可能的解呢?
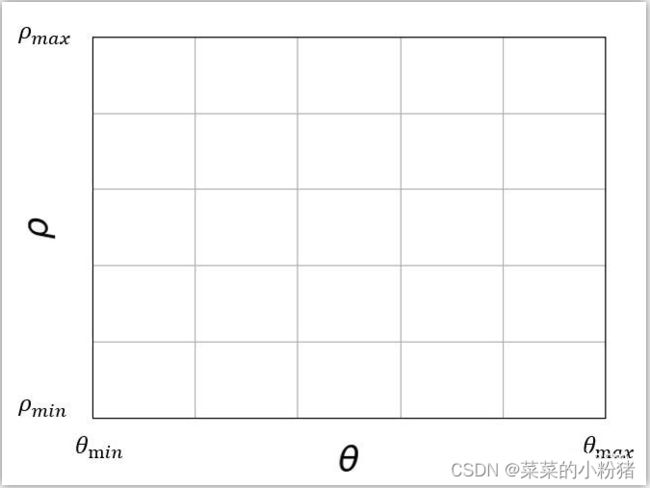
具体计算时,可将参数空间划分为所谓的累加单元 A ( θ , ρ ) A(\theta,\rho) A(θ,ρ)。如图下图所示,对于 x − y x-y x−y平面的每一个非背景点 ( x k , y k ) (x_k,y_k) (xk,yk),令 θ \theta θ等于每个可取的细分值,根据 θ = − x k θ + y k \theta=-x_k\theta+y_k θ=−xkθ+yk计算出对应的 ρ \rho ρ值,每计算出一组 A ( θ , ρ ) A(\theta,\rho) A(θ,ρ),则令 A ( θ , ρ ) = A ( θ , ρ ) + 1 A(\theta,\rho)=A(\theta,\rho)+1 A(θ,ρ)=A(θ,ρ)+1。计算所有结果后,找到 A ( θ , ρ ) A(\theta,\rho) A(θ,ρ)的峰值对应的 θ \theta θ和 ρ \rho ρ,即可检测直线。 ( θ m i n , θ m a x ) (\theta_{min},\theta_{max}) (θmin,θmax)和 ( ρ m i n , ρ m a x ) (\rho_{min},\rho_{max}) (ρmin,ρmax)是期望的参数范围: 0 ο ≤ θ ≤ 18 0 ο 0^\omicron \leq\theta \leq180^\omicron 0ο≤θ≤180ο和 − D ≤ θ ≤ D -D \leq\theta \leq D −D≤θ≤D, D D D是图像对角线的长度。 θ \theta θ和 ρ \rho ρ的细分数量决定了检测结果的精度。
投票过程可以观看下面的GIF,
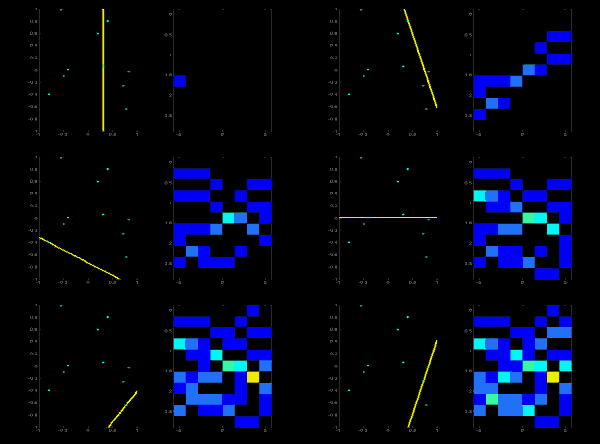
左边上青色的点代表图像上的像素点,黄色的代表对各个点不同角度搜索。右半边是投票盘,颜色越浅代表票数越多。
四、代码实现
1.hough检测
def lines_detector_hough(img,ThetaDim=None, DistStep=None, threshold=None, halfThetaWindowSize=2,
                         halfDistWindowSize=None):
    '''

    :param img: 经过边缘检测得到的二值图
    :param ThetaDim: hough空间中theta轴的刻度数量(将[0,pi)均分为多少份),反应theta轴的粒度,越大粒度越细
    :param DistStep: hough空间中dist轴的划分粒度,即dist轴的最小单位长度
    :param threshold: 投票表决认定存在直线的起始阈值
    :return: 返回检测出的所有直线的参数(theta,dist)和对应的索引值,
    '''
    row,col= edge.shape
    if ThetaDim == None:
        ThetaDim = 90
    if DistStep == None:
        DistStep = 1
    # 计算距离分段数量
    MaxDist = np.sqrt(row ** 2 + col ** 2)
    DistDim = int(np.ceil(MaxDist / DistStep))

    if halfDistWindowSize == None:
        halfDistWindowSize = int(DistDim /50)

    # 建立投票
    accumulator = np.zeros((ThetaDim, DistDim))  # theta的范围是[0,pi). 在这里将[0,pi)进行了线性映射.类似的,也对Dist轴进行了线性映射
    #
    sinTheta = [np.sin(t * np.pi / ThetaDim) for t in range(ThetaDim)]
    cosTheta = [np.cos(t * np.pi / ThetaDim) for t in range(ThetaDim)]
    #计算距离(rho)
    for i in range(row):
        for j in range(col):
            if not edge[i, j] == 0:
                for k in range(ThetaDim):
                    accumulator[k][int(round((i * cosTheta[k] + j * sinTheta[k]) * DistDim / MaxDist))] += 1
    M = accumulator.max()
#---------------------------------------
    #非极大抑制
    if threshold == None:
        threshold = int(M * 1.369/ 10)
    result = np.array(np.where(accumulator > threshold))  # 阈值化
    #获得对应的索引值
    temp = [[], []]
    for i in range(result.shape[1]):
        eight_neiborhood = accumulator[
                           max(0, result[0, i] - halfThetaWindowSize + 1):min(result[0, i] + halfThetaWindowSize,
                                                                              accumulator.shape[0]),
                           max(0, result[1, i] - halfDistWindowSize + 1):min(result[1, i] + halfDistWindowSize,
                                                                             accumulator.shape[1])]
        if (accumulator[result[0, i], result[1, i]] >= eight_neiborhood).all():
            temp[0].append(result[0, i])
            temp[1].append(result[1, i])
    #记录原图所检测的坐标点(x,y)
    result_temp= np.array(temp)
#-------------------------------------------------------------
    result = result_temp.astype(np.float64)
    result[0] = result[0] * np.pi / ThetaDim
    result[1] = result[1] * MaxDist / DistDim
    return result,result_temp
2.画直线代码
def drawLines(lines, edge, color=(255, 0, 0), err=3):

    '''
    :param lines: 检测后的直线参数
    :param edge: 原图
    :param color: 直线的颜色
    :param err:检测的可接受的误差值
    :return: 无
    '''

    if len(edge.shape) == 2:
        result = np.dstack((edge, edge, edge))
    else:
        result = edge
    Cos = np.cos(lines[0])
    Sin = np.sin(lines[0])

    for i in range(edge.shape[0]):
        for j in range(edge.shape[1]):
            e = np.abs(lines[1] - i * Cos - j * Sin)
            if (e < err).any():
                result[i, j] = color
    plt.imshow(result, cmap='gray')
    plt.axis('off')
    plt.show()
3.画hough空间代码
def data_img(data):

    '''
    :param data: 直线上含有的点(x,y)
    :return: 输出hough空间图像
    '''

    fig = plt.figure()  # 新建画布
    ax = axisartist.Subplot(fig, 111)  # 使用axisartist.Subplot方法创建一个绘图区对象ax
    fig.add_axes(ax)
    ax.axis[:].set_visible(False)  # 隐藏原来的实线矩形
    ax.axis["x"] = ax.new_floating_axis(0, 0, axis_direction="bottom")  # 添加x轴
    ax.axis["y"] = ax.new_floating_axis(1, 0, axis_direction="bottom")  # 添加y轴
    ax.axis["x"].set_axisline_style("->", size=1.0)  # 给x坐标轴加箭头
    ax.axis["y"].set_axisline_style("->", size=1.0)  # 给y坐标轴加箭头
    t = np.arange(-np.pi / 2, np.pi / 2, 0.1)
    ax.annotate(text='x', xy=(2 * math.pi, 0), xytext=(2 * math.pi, 0.1))  # 标注x轴
    ax.annotate(text='y', xy=(0, 1.0), xytext=(-0.5, 1.0))  # 标注y轴
    for i in range(data.shape[1]):
        rho = data[0][i] * np.cos(t) + data[1][i] * np.sin(t)
        plt.plot(t, rho)
    plt.show()
4.检测结果
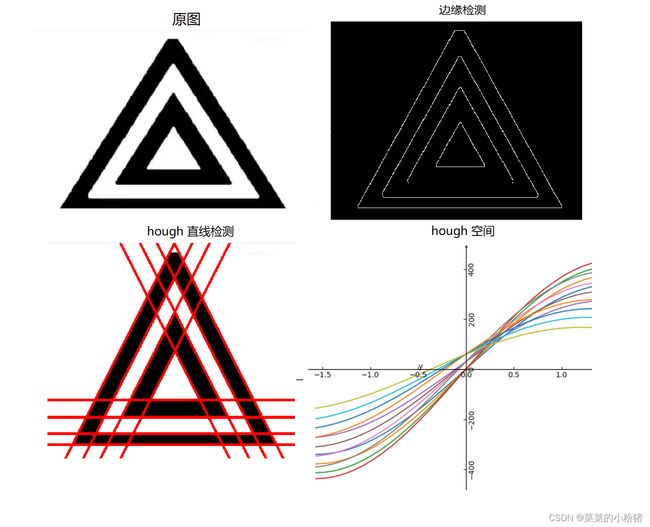
点击这里可以下载检测图片
全部代码可见本人GitHub仓库,如果代码有用,please click star
hough检测之前需要canny算子检测基础的边缘,点击这里可以查看有关canny算法相关内容
如果本文对你有帮助,关注加点赞!!!!!