cellchat最新完整版本
getwd()
dir.create("~/silicosis/fibroblast_20230930_universal_special/cellchat_fibroblast_macrohpages",recursive = TRUE)
setwd("~/silicosis/fibroblast_20230930_universal_special/cellchat_fibroblast_macrohpages")
dir.create("~/silicosis/fibroblast_20230930_universal_special/cellchat_fibroblast_macrohpages")
setwd("~/silicosis/fibroblast_20230930_universal_special/cellchat_fibroblast_macrohpages")
library(CellChat)
#####1 macrophage----
load("~/silicosis/silicosis_cluster_merge.rds")
library(Seurat)
library(ggplot2)
macrophage=subset(All.merge,idents=c('IM','AM1','AM2','AM3'))
#macrophage$cell.type=factor(macrophage$cell.type,levels = c('IM','AM1','AM2','AM3'))
macrophage$group=ifelse(grepl(pattern = 'NS',x = macrophage$stim),'NS','SiO2')
DimPlot(macrophage,label = TRUE)
macrophage$cell_type=Idents(macrophage)
#####2 fibroblast-----
dir.create("~/silicosis/fibroblast_myofibroblast/")
load("~/silicosis/fibroblast_myofibroblast/subset_data_fibroblast_myofibroblast.rds")
DimPlot(subset_data,label = TRUE,repel = TRUE)
DimPlot(subset_data,label = TRUE,split.by = 'group',repel = TRUE,label.size = 8)
head([email protected])
FeaturePlot(subset_data,features = c("Scgb1a1",'Epcam','Spp1','Inmt'))
ggplot([email protected],
aes(x=group, fill=Idents(subset_data))) + geom_bar(position = "fill")
#######3 fibro-macrophages---------
subset_data2=merge(subset_data,macrophage)
#DimPlot(subset_data2,label = TRUE)
subset_data=subset_data2
subset_data=subset_data2[,grep(pattern = "Inflammatory fibroblast",x = Idents(subset_data2),invert = TRUE) ]
subset_data[["percent.mt"]] <- PercentageFeatureSet(subset_data, pattern = "^mt-")
VlnPlot(subset_data, features = c("nFeature_RNA", "nCount_RNA", "percent.mt"), ncol = 3)
library(dplyr)
subset_data = subset_data %>%
Seurat::NormalizeData(verbose = FALSE) %>%
FindVariableFeatures(selection.method = "vst", nfeatures = 2000) %>%
ScaleData(verbose = FALSE) %>%
RunPCA(npcs = 50, verbose = FALSE)
ElbowPlot(subset_data, ndims = 50)
VlnPlot(subset_data, features = c("nFeature_RNA", "nCount_RNA", "percent.mt"), ncol = 3)
## 466 510
#[email protected]$stim <- c(rep("Exp", length(grep("1$",colnames(subset_data)))),rep("Con", length(grep("2$",colnames(subset_data)))))
#table(subset_data$stim)
library('harmony')
subset_data <- subset_data %>% RunHarmony("stim", plot_convergence = TRUE)
harmony_embeddings <- Embeddings(subset_data, 'harmony')
#######################cluster
dims = 1:30
subset_data <- subset_data %>%
RunUMAP(reduction = "harmony", dims = dims) %>%
RunTSNE(reduction = "harmony", dims = dims) %>%
FindNeighbors(reduction = "harmony", dims = dims)
subset_data=FindClusters(subset_data,resolution =0.3)
DimPlot(subset_data,label = TRUE,repel = TRUE)
DimPlot(subset_data,label = TRUE,repel = TRUE,reduction = 'tsne')
head([email protected])
#########cellchat-------
#library(dplyr)
library(cowplot)
library(Seurat)
library(harmony)
library(ggplot2)
require(Matrix)
require(magrittr)
library(openxlsx)
#BiocManager::install('CellChat',force = TRUE)
#devtools::install_github("jinworks/CellChat",dependencies = TRUE)
library(CellChat)
getwd()
table(Idents(subset_data))
table(subset_data$group)
#subset_data$stim=subset_data$group
print(getwd())
DimPlot(subset_data,label =TRUE,group.by = 'cell.type',reduction = 'tsne')
table(Idents(subset_data))
Idents(subset_data)=subset_data$cell_type
path=getwd()
#head([email protected])
#Idents(subset_data)
#table(subset_data$stim)
## CellChat
dir.create(paste(path, "CellChat", sep = "/"))
setwd(paste(path, "CellChat", sep = "/"))
getwd()
#setwd("../")
dev.off()
for(stim in unique(subset_data$stim)){
#stim="NS_56"
#stim="SiO2_7","NS_7"
print(stim)
path="~/silicosis/fibroblast_20230930_universal_special/cellchat_fibroblast_macrohpages"
dir.create(paste(path, "cellchat", stim, sep = "/"),recursive = TRUE)
setwd( paste(path, "cellchat", stim, sep = "/") )
getwd()
data.input = subset_data$RNA@data[, subset_data$stim==stim]
head(data.input)
meta = data.frame(labels = Idents(subset_data)[subset_data$stim==stim], row.names = colnames(subset_data)[subset_data$stim==stim])
head(meta)
meta$labels = droplevels(meta$labels, exclude = setdiff(levels(meta$labels),unique(meta$labels)))
cellchat <- createCellChat(object = data.input, meta = meta, group.by = "labels")
CellChatDB <- CellChatDB.mouse
cellchat@DB <- CellChatDB
cellchat <- subsetData(cellchat)
#future::plan("multiprocess", workers = 4)
cellchat <- identifyOverExpressedGenes(cellchat)
cellchat <- identifyOverExpressedInteractions(cellchat)
cellchat <- projectData(cellchat, PPI.mouse)
cellchat <- computeCommunProb(cellchat) #不可有有为0的细胞数的组
cellchat <- filterCommunication(cellchat, min.cells = 0) #设置最低细胞数 通常为10
cellchat <- computeCommunProbPathway(cellchat)
cellchat <- aggregateNet(cellchat)
df.net <- subsetCommunication(cellchat)
write.xlsx(df.net,file='0.Cell-Cell_Communications_At_L-R.xlsx', rowNames=F, colNames=T)
df.net <- subsetCommunication(cellchat, slot.name = "netP")
write.xlsx(df.net,file='0.Cell-Cell_Communications_At_Pathway.xlsx', rowNames=F, colNames=T)
groupSize <- as.numeric(table(cellchat@idents))
## NumberOfInteractions
mat <- cellchat@net$count
write.xlsx(mat, file='1.NumberOfInteractions.xlsx', rowNames=T, colNames=T)
pdf("1.NumberOfInteractions.pdf")
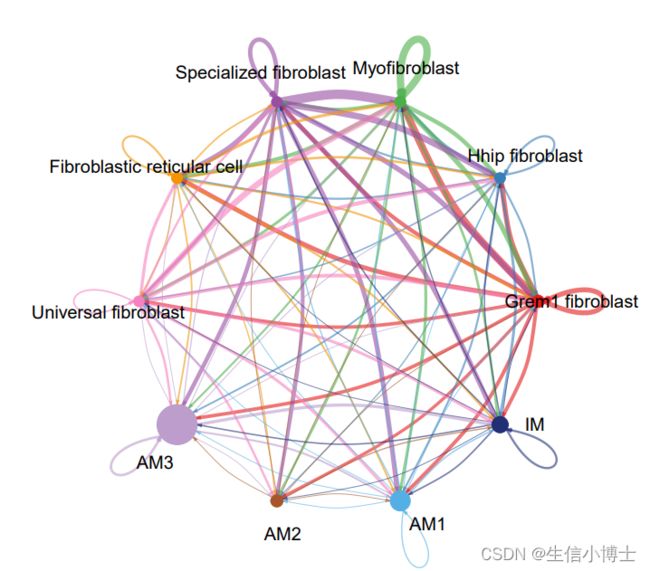
netVisual_circle(mat, vertex.weight = groupSize, weight.scale = T, label.edge= F, title.name = "Number of interactions")
dev.off()
mat
#devtools::install_github("igraph/rigraph")
# Error in i_set_edge_attr(x, attr(value, "name"), index = value, value = attr(value, :
# Length of new attribute value must be 1 or 9, the number of target edges, not 2
pdf("1.NumberOfInteractions_Split.pdf")
for (i in 1:nrow(mat)) {
#i=1
mat2 <- matrix(0, nrow = nrow(mat), ncol = ncol(mat), dimnames = dimnames(mat))
mat2
mat2[i, ] <- mat[i, ]
p = netVisual_circle(mat2, vertex.weight = groupSize, weight.scale = T, edge.weight.max = max(mat), title.name = rownames(mat)[i])
print(p)
}
dev.off()
## InteractionWeights
mat <- cellchat@net$weight
write.xlsx(mat, file='2.InteractionWeights.xlsx', rowNames=T, colNames=T)
pdf("2.InteractionWeights.pdf")
netVisual_circle(mat, vertex.weight = groupSize, weight.scale = T, label.edge= F, title.name = "Interaction weights/strength")
dev.off()
#install.packages('igraph',version='1.3.5')
pdf("2.InteractionWeights_Split--.pdf")
library(igraph)
for (i in 1:nrow(mat)) {
# i=4
print(i)
mat2 <- matrix(0, nrow = nrow(mat), ncol = ncol(mat), dimnames = dimnames(mat))
mat2[i, ] <- mat[i, ]
mat2
p = netVisual_circle(mat2, vertex.weight = groupSize, weight.scale = T, edge.weight.max = max(mat), title.name = rownames(mat)[i])
print(p)
}
dev.off()
## cellchat@netP$pathways: the signaling pathways showing significant communications
getwd()
pathways = cellchat@netP$pathways
## the left portion shows autocrine and paracrine signaling to certain cell groups of interest (i.e, the defined vertex.receiver)
## the right portion shows autocrine and paracrine signaling to the remaining cell groups in the dataset
vertex.receiver = seq(1,5)
print(getwd())
pdf("3.Sig_Pathway_Hierarchy_Plot_.pdf")
for(i in pathways){
#i=1
print(i)
p = netVisual_aggregate(cellchat, signaling = i,vertex.receiver = vertex.receiver,
vertex.label.cex = 0.4,layout = 'hierarchy')
title(main = paste0(i,' signaling'))
print(p)
}
dev.off()
getwd()
# a=1
# a
# getwd()
# setwd("./cellchat/SiO2_7/")
# load("./cellchat/SiO2_7/cellchat_SiO2_7_.RData")
# pathways = cellchat@netP$pathways
#
library(CellChat)
pdf("3.Sig_Pathway_Circle_Plot_.pdf")
for(i in pathways){
print(i)
p = netVisual_aggregate(cellchat,show.legend = TRUE,
signaling = i,signaling.name = paste(i,"sigaling"),
,pt.title=10,vertex.receiver = vertex.receiver, layout = "circle")
title(main = paste0(i,' signaling'))
print(p)
}
dev.off()
pdf("4.Sig_Pathway_L-R_pair_Contribution.pdf")
for(i in pathways){
print(i)
p = netAnalysis_contribution(cellchat, signaling = i, title = paste0(i, " signaling pathway", " Contribution of each L-R pair"))
print(p)
}
dev.off()
pdf("4.Sig_Pathway_L-R_pair_bubbleplot.pdf", width=25, height=20)
p = netVisual_bubble(cellchat, remove.isolate = FALSE)
print(p)
dev.off()
cellchat <- netAnalysis_computeCentrality(cellchat, slot.name = "netP")
pdf("5.Signaling_Roles_Of_Cell_Groups_Heatmap.pdf")
for(i in pathways){
print(i)
p = netAnalysis_signalingRole_network(cellchat, signaling = i, width = 8, height = 2.5, font.size = 10)
print(p)
}
dev.off()
pdf("4.Sig_Pathway_L-R_pair_bubbleplot.pdf", width=25, height=20)
p = netVisual_bubble(cellchat, remove.isolate = FALSE)
print(p)
dev.off()
pdf("5.Signaling_Roles_Of_Cell_Groups_2D.pdf")
p = netAnalysis_signalingRole_scatter(cellchat)
print(p)
dev.off()
pdf("5.signals_Contribution_Of_Cell_Groups_Heatmap.pdf", width=10)
ht1 <- netAnalysis_signalingRole_heatmap(cellchat, pattern = "outgoing", font.size = 5)
ht2 <- netAnalysis_signalingRole_heatmap(cellchat, pattern = "incoming", font.size = 5)
print(ht1 + ht2)
dev.off()
save(cellchat, file = paste0("cellchat_",stim,"_.RData"))
}
# for(i in unique(subset_data$stim)){
# setwd( paste(path, "cellchat", i, sep = "/") )
# load("cellchat.RData")
# pdf("4.Sig_Pathway_L-R_pair_bubbleplot--.pdf", width=25, height=20)
# p = netVisual_bubble(cellchat, remove.isolate = FALSE)
# print(p)
# dev.off()
# }