gc()
#####安装archr包##别处复制
.libPaths(c("/home/data/t040413/R/x86_64-pc-linux-gnu-library/4.2",
"/home/data/t040413/R/yll/usr/local/lib/R/site-library",
"/usr/local/lib/R/library",
"/home/data/refdir/Rlib/"))
.libPaths()
library(Seurat)
library(ggplot2)
library(dplyr)
getwd()
dir.create("~/silicosis/spatial/monocle/silicosis_fibroblasts")
setwd("~/silicosis/spatial/monocle/silicosis_fibroblasts")
print(getwd())
##1 加载silicosis数据-------
#load("/home/data/t040413/silicosis/data/tabula_scRNAseq/integration_with_sc_silicosis/silicosis_fibro_AM3_mappedbacked.rds")
load('/home/data/t040413/silicosis/fibroblast_myofibroblast2/subset_data_fibroblast_myofibroblast2.rds')
#subset_data=RenameIdents(subset_data,'Specialized fibroblast'='Inmt fibroblast')
#save(subset_data,file ='/home/data/t040413/silicosis/fibroblast_myofibroblast2/subset_data_fibroblast_myofibroblast2.rds' )
DimPlot(subset_data,label = TRUE)
subset_data$cell.type=Idents(subset_data)
table(subset_data$cell.type)
[email protected] %>%head()
subset_data$celltype=subset_data$cell.type
DimPlot(subset_data,label = T,group.by = "celltype")
##############################################################33###monocle
#################################################
subset_data$cell.type=Idents(subset_data)
#Idents(subset_data)=subset_data$Idents.subset_data.
###注意使用RNA 还是SCT
DefaultAssay(subset_data)
DefaultAssay(subset_data)="RNA"
table(duplicated(rownames(subset_data)))
table(duplicated(colnames(subset_data)))
table(Idents(subset_data))
DefaultAssay(subset_data)
new.metadata <- merge([email protected],
data.frame(Idents(subset_data)),
by = "row.names",sort = FALSE)
head(new.metadata)
rownames(new.metadata)<-new.metadata[,1]
#可选
head([email protected])
new.metadata=new.metadata[,-1]
head([email protected])
identical(rownames(new.metadata),rownames([email protected]))
[email protected]<-new.metadata
table(subset_data$cell.type,Idents(subset_data))
head(subset_data)
expression_matrix <- as(as.matrix(subset_data@assays$RNA@counts), 'sparseMatrix')
head(expression_matrix)
identical(colnames(expression_matrix),rownames(new.metadata))
cell_metadata <- new('AnnotatedDataFrame',[email protected])
head([email protected])
head(cell_metadata)
gene_annotation <- new('AnnotatedDataFrame',data=data.frame(gene_short_name = row.names(subset_data),
row.names = row.names(subset_data)))
head(gene_annotation)
'''
head(gene_annotation)
fData(gene_annotation)
phenoData(gene_annotation)
featureData(gene_annotation)
table(subset_data$cell.type)
length(subset_data$cell.type)
table(Idents(subset_data))
length(Idents(subset_data))
'''
DimPlot(subset_data,group.by = "cell.type",label = T)
DimPlot(subset_data,label = T)
devtools::load_all("/home/data/t040413/ipf/diseased_lung_covid20/monocle/")
monocle_cds <- monocle::newCellDataSet(expression_matrix,
phenoData = cell_metadata,
featureData = gene_annotation,
lowerDetectionLimit = 0.5,
expressionFamily = negbinomial.size())
###################################################################################
##归一化######
cds <- monocle_cds
cds <- estimateSizeFactors(cds)
cds <- estimateDispersions(cds) ## Removing 110 outliers #下面的cell.type 为subset_Data 的meta信息
library("BiocGenerics")#并行计算
devtools::load_all("/home/data/t040413/ipf/diseased_lung_covid20/monocle/")
diff_test_res <- differentialGeneTest(cds,fullModelFormulaStr = "~ cell.type")
### inference the pseudotrajectory########################################################
# step1: select genes for orderding setOrderingFilter() #
ordering_genes <- row.names (subset(diff_test_res, qval < 0.01))
length(ordering_genes)# 6354
cds <- setOrderingFilter(cds, ordering_genes)
# step2: dimension reduction=> reduceDimension() DDRTree #
cds <- reduceDimension(cds, max_components = 2,method = 'DDRTree')
#package.version(pkg = "monocle")
# step3: ordering the cells=> orderCells()
#getwd()
#source("./order_cells.R")
#unloadNamespace('monocle')
#devtools::load_all("../monocle_2.26.0 (1).tar/monocle_2.26.0 (1)/monocle/")
devtools::load_all("/home/data/t040413/ipf/diseased_lung_covid20/monocle/")
cds <- orderCells(cds)
pdf("1.pseudutime.cell.type.pre.order.pdf")
plot_cell_trajectory(cds, color_by = "cell.type")
dev.off()
pdf("1.pseudutime.stim.pre.order.pdf")
plot_cell_trajectory(cds, color_by = "stim")
dev.off()
pdf("1.pseudutime.State.pre.order.pdf")
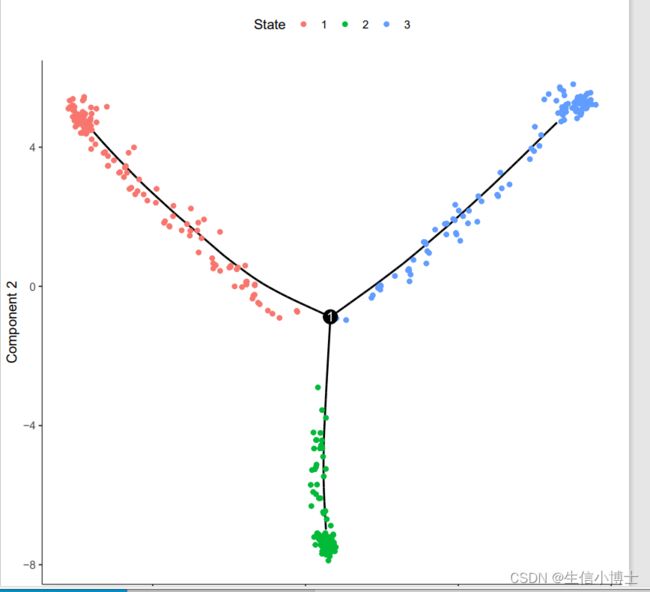
plot_cell_trajectory(cds, color_by = "State")
dev.off()
###### split ########
pdf("2.split.pseudutime.Seurat.cell.type.pdf")
plot_cell_trajectory(cds, color_by = 'cell.type') + facet_wrap(~cell.type)
dev.off()
pdf("2.split.pseudutime.stim.pdf")
plot_cell_trajectory(cds, color_by = "stim") + facet_wrap(~stim)
dev.off()
pdf("4.split.pseudutime.Seurat.State.pdf")
plot_cell_trajectory(cds, color_by = 'cell.type') + facet_wrap(~State)
dev.off()
pdf("3.split.pseudutime.Seurat.cell.type_State.pdf")
plot_cell_trajectory(cds, color_by = 'State') + facet_wrap(~cell.type)
dev.off()
table(pData(cds)$State,pData(cds)$cell.type)
openxlsx::write.xlsx(table(pData(cds)$State,pData(cds)$cell.type), "State_cellType_summary.xlsx", colnames=T, rownames=T)
table(pData(cds)$State,pData(cds)$stim)
openxlsx::write.xlsx(table(pData(cds)$State,pData(cds)$stim), "State_Stim_summary.xlsx", colnames=T, rownames=T)
getwd()
##we set the state 2 as root ########state 2 with most cells in Endothelial cells
#这里设置谁为root??
DimPlot(subset_data,label = T)
table(Idents(subset_data))
DefaultAssay(subset_data)
#DefaultAssay(subset_data)<-"SCT"
DefaultAssay(subset_data)<-"RNA"
DimPlot(subset_data,label = T)
dev.off()
table(subset_data$cell.type)
getwd()
#设置root
ds <- orderCells(cds,root_state=2)
getwd()# "/home/data/t040413/ipf/fibro_myofibro_recluster/+meso_monocle"
pdf("4.pseudutime.Pseudotime.pdf")
p=plot_cell_trajectory(cds, color_by = "Pseudotime")
print(p)
dev.off()
save(cds,file="./cds_fibroblast_using_RNA_slot.rds")
#######################################################
save(subset_data,file = "./fibroblast_formonocle.rds")
getwd()
load("./cds_fibroblast_using_RNA_slot.rds")
Idents(subset_data)
Markers_foreachclustercells=FindAllMarkers(subset_data,only.pos = T,logfc.threshold = 0.5)
openxlsx::write.xlsx(Markers_foreachclustercells,
file="./Markers_foreachclustercells.xlsx")
getwd()
#############https://cloud.tencent.com/developer/article/1692225
#################################3
#Once we have a trajectory, we can use differentialGeneTest() to find genes
#that have an expression pattern that varies according to pseudotime.
#高变基因
disp_table <- dispersionTable(cds)
disp.genes <- subset(disp_table, mean_expression >= 0.5&dispersion_empirical >= 1*dispersion_fit)
disp.genes <- as.character(disp.genes$gene_id)
disp.genes
diff_test <- differentialGeneTest(cds[disp.genes,], # cores = 4,
fullModelFormulaStr = "~sm.ns(Pseudotime)")
sig_gene_names <- row.names(subset(diff_test, qval < 1e-04))
p2 = plot_pseudotime_heatmap(cds[sig_gene_names,], num_clusters=5,
show_rownames=T, return_heatmap=T)
ggsave("pseudotime_heatmap2.pdf", plot = p2, width = 5, height = 10)
plot_pseudotime_heatmap(cds[c('Cx3cr1',"Spp1"),],
# num_clusters = 5,
# cores = 4,
show_rownames = T)
###########################cds 里面的内容
fData(cds) %>%head()
pData(cds) %>%head()
subset(fData(cds),
gene_short_name %in% c("TPM1", "MYH3", "CCNB2", "GAPDH"))
#############感兴趣基因的变化图
head([email protected])
plot_genes_jitter(cds[c("TPM1", "MYH3", "CCNB2", "GAPDH"),],
grouping = "cell.type", color_by = "cell.type", plot_trend = TRUE) +
facet_wrap( ~ feature_label, scales= "free_y")
#######拟时序热图
sig_gene_names=markers_for_eachcluster %>%
group_by(cluster) %>% top_n(n = 5,wt = avg_log2FC) %>% ##加不加引号区别很大
select(gene) %>% ungroup() %>%
pull(gene)
getwd()
p1 = plot_pseudotime_heatmap(cds[sig_gene_names,], num_clusters=3,
show_rownames=T, return_heatmap=T)
ggsave("pseudotime/pseudotime_heatmap1.png", plot = p1, width = 5, height = 8)
############################3
BEAM分析
devtools::load_all("/home/data/t040413/ipf/diseased_lung_covid20/monocle/")
#单细胞轨迹中通常包括分支,它们的出现是因为细胞的表达模式不同。当细胞做出命运选择时,或者遗传、化学或环境扰动时,就会表现出不同的基因表达模式。BEAM(Branched expression analysis modeling)是一种统计方法,用于寻找以依赖于分支的方式调控的基因。
disp_table <- dispersionTable(cds)
disp.genes <- subset(disp_table, mean_expression >= 0.5&dispersion_empirical >= 1*dispersion_fit)
disp.genes <- as.character(disp.genes$gene_id)
mycds_sub <- cds[disp.genes,]
plot_cell_trajectory(mycds_sub, color_by = "State")
beam_res <- BEAM(mycds_sub, branch_point = 1,##如果大于1 后面一个参数就不需要
progenitor_method = "duplicate") #, cores = 8
beam_res <- beam_res[order(beam_res$qval),]
beam_res <- beam_res[,c("gene_short_name", "pval", "qval")]
mycds_sub_beam <- mycds_sub[row.names(subset(beam_res, qval < 1e-4)),]
plot_genes_branched_heatmap(mycds_sub_beam, branch_point = 1, num_clusters = 3, show_rownames = T)
methods <- c("duplicate", "expression", "cluster")
results <- lapply(methods, function(method) {
beam_res=BEAM(mycds_sub, branch_point = 1, progenitor_method = method)
beam_res <- beam_res[order(beam_res$qval),]
beam_res <- beam_res[,c("gene_short_name", "pval", "qval")]
mycds_sub_beam <- mycds_sub[row.names
(subset(beam_res, qval < 1e-4)),]
results= plot_genes_branched_heatmap(mycds_sub_beam, branch_point = 1, num_clusters = 3, show_rownames = T)
for (each in names(results)) {
pdf(paste0(each,".pdf"),height = 100,width = 10)
print(each)
dev.off()
}
})
################################################################################
#https://davetang.org/muse/2017/10/01/getting-started-monocle/
my_pseudotime_de %>% arrange(qval) %>% head()
# save the top 6 genes
my_pseudotime_de %>% arrange(qval) %>% head() %>% select(id) -> my_pseudotime_gene
my_pseudotime_gene <- my_pseudotime_gene$id
plot_genes_in_pseudotime(my_cds_subset[my_pseudotime_gene,])