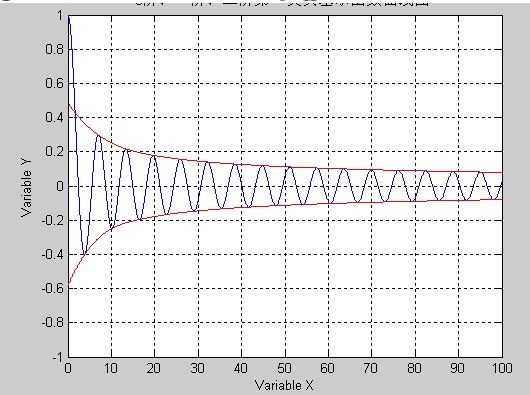
零阶一类贝塞尔函数曲线及其包络线 matlab源程序
废话不多说,请看源程序:
clear ,clc;
format long
x=(0:0.01:100)';
y_0=besselj(0,x);
% y_1=besselj(1,x); %一阶,这里只画了0阶
% y_2=besselj(2,x); %二阶


plot(x,y_0);grid on;
axis([0,100,-1,1]);
title('0阶贝塞尔函数曲线图');
xlabel('Variable X');
ylabel('Variable Y');

%画包络线
hold on;
[up,down] = envelope(x,y_0,'spline');
plot(x, up, 'r');
plot(x, down, 'r');
其中的envelope是个单独的.m文件,是个函数,用来画包络线。说白了就是求拐点然后插值:
function [up,down] = envelope(x,y,interpMethod)

%ENVELOPE gets the data of upper and down envelope of the known input (x,y).
%
% Input parameters:
% x the abscissa of the given data
% y the ordinate of the given data
% interpMethod the interpolation method
%
% Output parameters:
% up the upper envelope, which has the same length as x.
% down the down envelope, which has the same length as x.
%
% See also DIFF INTERP1

% Designed by: Lei Wang, <[email protected]>, 11-Mar-2003.
% Last Revision: 21-Mar-2003.
% Dept. Mechanical & Aerospace Engineering, NC State University.
% $Revision: 1.1 $ $Date: 3/21/2003 10:33 AM $

if length(x) ~= length(y)
error('Two input data should have the same length.');
end

if (nargin < 2)|(nargin > 3),
error('Please see help for INPUT DATA.');
elseif (nargin == 2)
interpMethod = 'linear';
end


% Find the extreme maxim values
% and the corresponding indexes
%----------------------------------------------------
extrMaxValue = y(find(diff(sign(diff(y)))==-2)+1);
extrMaxIndex = find(diff(sign(diff(y)))==-2)+1;


% Find the extreme minim values
% and the corresponding indexes
%----------------------------------------------------
extrMinValue = y(find(diff(sign(diff(y)))==+2)+1);
extrMinIndex = find(diff(sign(diff(y)))==+2)+1;


up = extrMaxValue;
up_x = x(extrMaxIndex);

down = extrMinValue;
down_x = x(extrMinIndex);


% Interpolation of the upper/down envelope data
%----------------------------------------------------
up = interp1(up_x,up,x,interpMethod);
down = interp1(down_x,down,x,interpMethod);
效果:
源程序下载:http://www.pudn.com/downloads495/sourcecode/windows/other/detail2062657.html
csdn上传资源标签里竟然没有Matlab,桑不起啊。。。。
