机器学习实践一
根据问题是否有标签将机器学习问题分为监督学习问题(有标签)和非监督学习问题(无标签)。
监督学习又可根据预测结果是否连续分为回归问题(预测值为连续的)和分类问题(预测值为离散的)。
常见的监督学习算法:线性回归,逻辑回归,KNN,决策树,SVM,朴素贝叶斯。
无监督学习算法:关联规则,聚类
半监督学习:一半有标签,一半无标签。
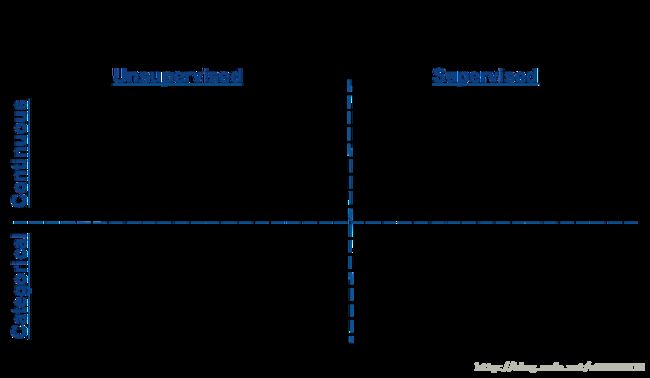
机器学习算法使用图谱
数据量少的话可以使用规则去学习,此时所有的机器学习算法都不能从中学习到模型。倘诺数据多根据结果连续,离散,有无标签分为回归和分类,聚类,倘诺数据的维度较大需要将维处理。在分类问题中,根据样本的数据能否一次加载到内存中又可分别进行linear svc,SGD。
机器学习问题解决思路
- 拿到数据后咋么了解数据(可视化)
- 选择最贴切的机器学习算法
- 定位模型状态(过拟合或欠拟合)以及解决方法
- 大量级的数据的特征分析以及可视化
- 各种损失函数(loss function)的优缺点及如何选择
数据与可视化
#numpy科学计算工具包
import numpy as np
#使用make_classification构造1000个样本,每个样本有20个feature
from sklearn.datasets import make_classification
X,y=make_classification(1000,n_features=20,n_informative=2,
                       n_redundant=2,n_classes=2,random_state=0)
#存为dataframe格式
from pandas import DataFrame
df=DataFrame(np.hstack((X,y[:,None])),columns=range(20)+["class"])df[:6]import matplotlib.pyplot as plt
import seaborn as sns
#使用pairplot去看不同维度pair下数据的空间分布状况
_=sns.pairplot(df[:50],vars=[8,11,12,14,19],hue="class",size=1.5)
plt.show()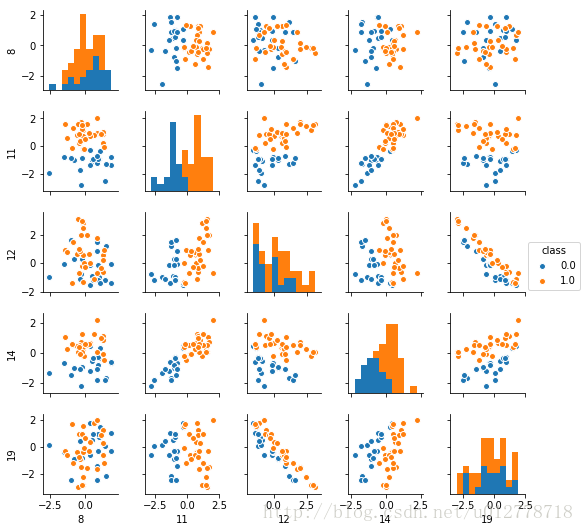
我们从散点图和柱状图上可以看出,有些维度的特征确实比其他的维度有更好的区分性,比如第11维和第14维的区分度比较好。从这两个维度,数据似乎是现行可分的。而12维和19维呈现很强的负相关性。
seaborn.pairplot(data,hue=None,hue_order=None,palette=None,vars=None,x_vars=None,y_vars=None,kind='scatter',diag_kind='hist',markers=None,size=2.5,aspect=1,dropna=True,plot_kws=None,diag_kws=None,grid_kws=None)数据指定
- vars:与data使用,否则使用data的全部变量。参数类型:numeric类型的变量list
{x,y}_vars:与data使用,否则使用data的全部变量。参数类型:numeric类型的list - dropna:否则剔除缺失值。参数类型:Boolean,optional
特殊参数
- kind:{‘scatter’,’reg’},optional Kind of plot for the non-identity relationships
- diag_kind:{‘hist’,’kde’},optional.Kind of plot for the diagonal subplots
基本参数
- size:默认6,图的尺寸大小(正方形)。参数类型:numeric
- hue:使用指定变量为分类变量画图。参数类型:string species/class
- hue_order:list of strings Order for the levels of the hue variable in the palette
- palette:调色板颜色
- markers:使用不同的形状。参数类型:list
- aspect:scalar,optional。Aspect * size gives the width (in inches)of each facet
- {plot,diag,grid}_kws:指定其他参数。参数类型:dicts
返回
PairGrid对象
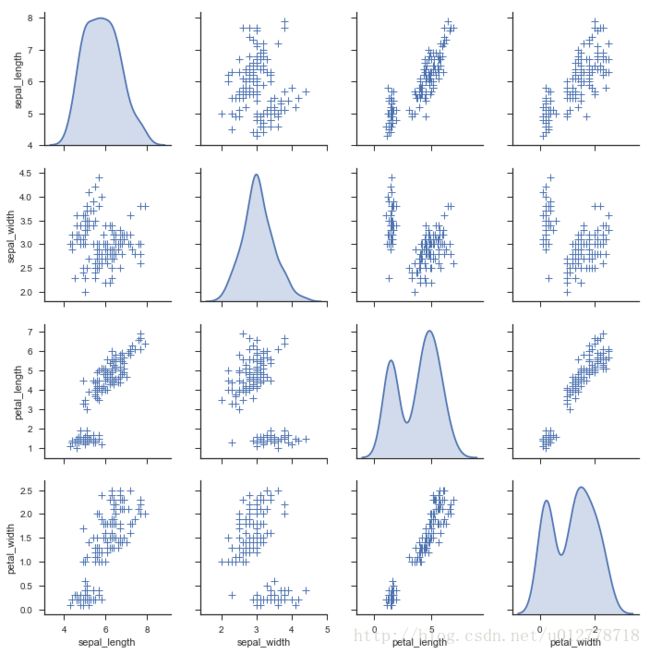
1. 散点图
from __future__ import division
import numpy as np
import matplotlib.pyplot as plt
import seaborn as sns
sns.set(style='ticks',color_codes=True)
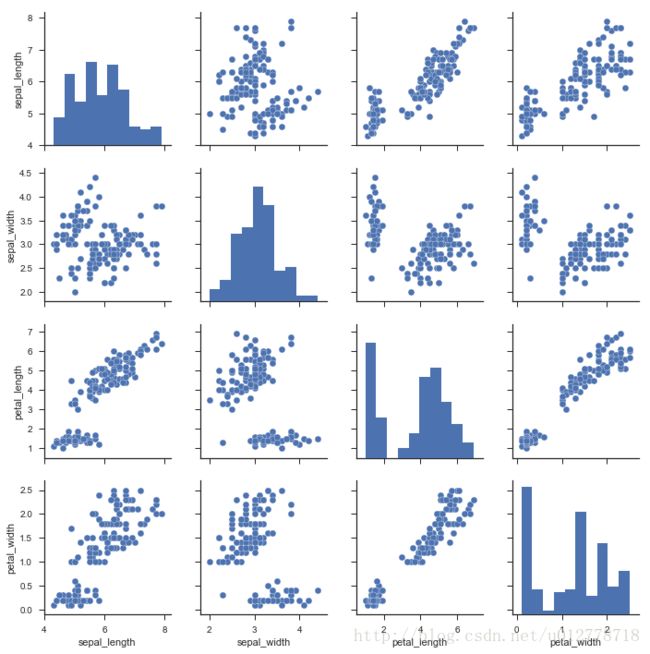
iris=sns.load_dataset("iris")
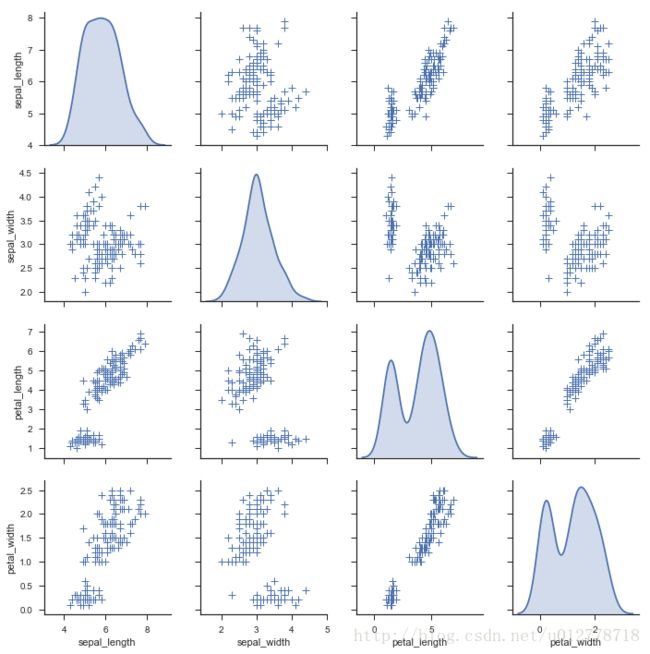
sns.pairplot(iris)
plt.show()
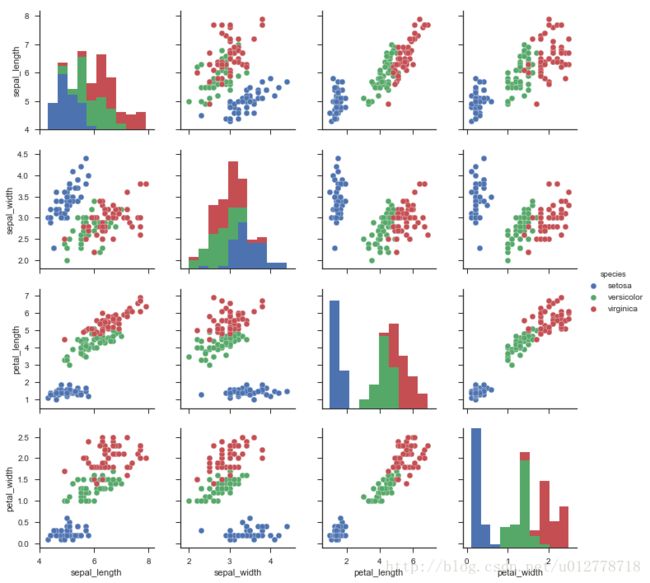
指定分类变量的散点图
sns.pairplot(iris,hue="species")
plt.show()
使用调色板
sns.pairplot(iris,hue="species",palette="husl")
plt.show()
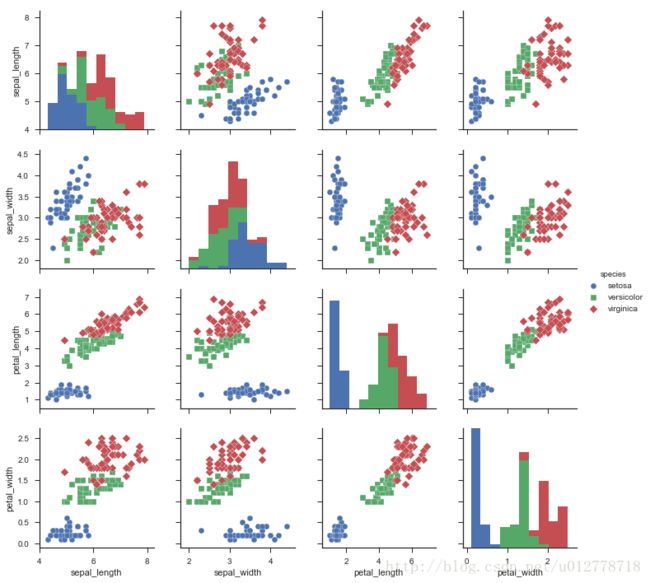
使用不同的形状
sns.pairplot(iris,hue="species",markers=["o","s","D"])
plt.show()
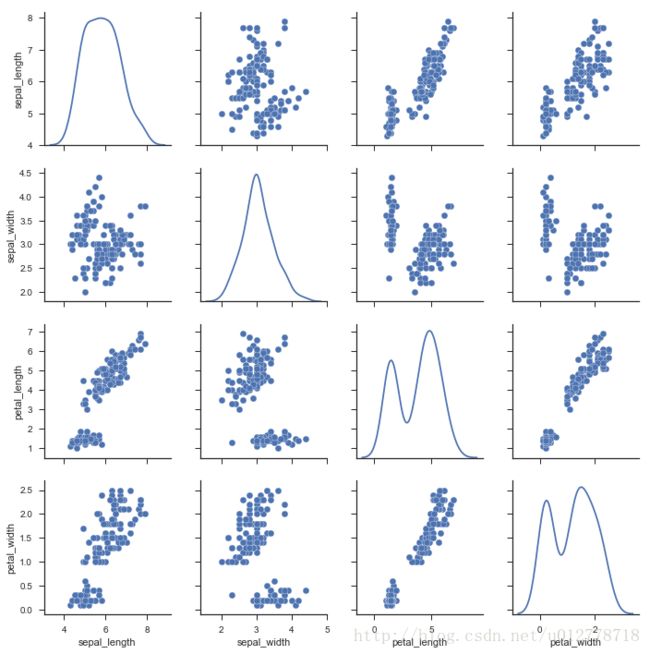
3.改变对角图
sns.pairplot(iris,diag_kind="kde")
plt.show()
使用回归
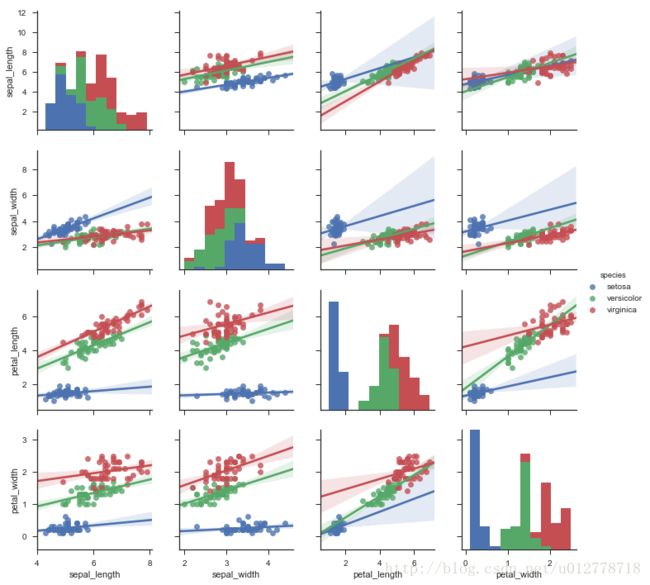
sns.pairplot(iris,kind="reg")
plt.show()
改变地的形状,使用参数,使用edgecolor
机器学习算法选择
我们只有1000个数据样本,是分类问题,同时是一个监督学习,因此我们根据图谱里教的方法,使用linearSVC(support vector classification with linear kernel)。注意,linearSVC需要选择正则化方法以缓解过拟合问题;我们这里选择使用最多的L2正则化,并把惩罚系数C设置为10。我们改写一下sklearn中的学习曲线绘制函数,画出训练集和交叉验证集上的得分。
from sklearn.svm import LinearSVC
from sklearn.learning_curve import learning_curve
#绘制学习曲线,以确定模型的状况
def plot_learning_curve(estimator,title,X,y,ylim=None,cv=None,
                       train_sizes=np.linspace(.1,1.0,5)):
    """
    画出data在数据集上的learning curve。
    参数解释
    ----------
    estimator:你的分类器
    title:表格的标题
    X:输入的feature,numpy类型  训练向量 shape(n_samples(样本的数量),n_features(特征的数量))
    y:输入的target vector     目标相对于X的分类或回归
    ylim:tuple格式的(ymin,ymax),设定图像纵坐标的最低点和最高点
    cv:做交叉验证的时候,数据分成的份数,其中一份作为cv集,其余n-1分作为training(默认为3分) 确认是几折交叉验证
    train_size:array-like,shape(n_ticks),dtype float or int 训练集的绝对或相对值,这些量的样本将会生成larning_curve。如果dtype是float
    它会被视为最大训练集的比例,
    n_jobs:并行运算的个数
    返回值
    train_size_abs:用于生成learning_curve的训练集的样本数。由于重复的输入将会被删除  array shape=(n_unique_ticks)
    train_scores:在训练集上的分数,
    test_scores:在测试集上的分数


    linspace(1,10)将1-10之间等间隔50份
    linspace(1,10,10)将1-10之间等间隔10份


    np.mean():求均值。axis不设置值,对m*n个数求均值,返回一个实数
    axis=0,压缩行,对各列求均值,返回一个1*n矩阵
    axis=1,压缩列,对个哈哈那个求均值,返回一个m*1的矩阵

    fill_between,填充两个函数之间的区域

    """
    plt.figure()
    print(train_sizes)
    train_size,train_scores,test_scores=learning_curve(
    estimator,X,y,cv=5,n_jobs=1,train_sizes=train_sizes)
    train_scores_mean=np.mean(train_scores,axis=1)
    train_scores_std=np.std(train_scores,axis=1)
    test_scores_mean=np.mean(test_scores,axis=1)
    test_scores_std=np.std(test_scores,axis=1)
    plt.fill_between(train_sizes,train_scores_mean-train_scores_std,train_scores_mean+train_scores_std,
                    alpha=0.5,color='r')
    plt.fill_between(train_sizes,test_scores_mean-test_scores_std,test_scores_mean+test_scores_std,
                    alpha=0.5,color='g')
    plt.plot(train_sizes,train_scores_mean,'o-',color='r',
            label='Training score')
    plt.plot(train_sizes,test_scores_mean,'o-',color='g',
            label="cross-validation score")
 #plt.legend()用于标注各种线条的含义 可以调整  可取值为upper center  best
#plt.grid() 是否在图上显示网格
#用于设置坐标轴的显示范围
    plt.xlabel('Training examples')
    plt.ylabel('Score')
    plt.legend(loc='best')
    plt.grid('on')
    if ylim:
        plt.ylim(ylim)
    plt.title(title)
    plt.show()

#少量样本的情况绘出学习曲线
plot_learning_curve(LinearSVC(C=10.0),"linearSVC(C=10.0)",X,y,ylim=(0.8,1.01),
                   train_sizes=np.linspace(.05,0.2,5))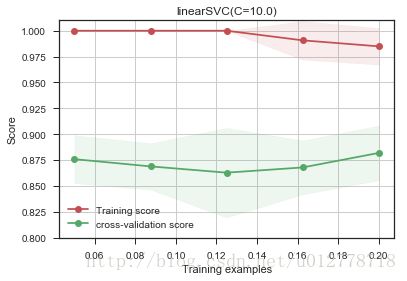
虽然随着训练集的增加,测试误差有一定的升高,但训练误差和测试误差仍然很大。这意味着模型处于过拟合状态。
过拟合如何解决
- 增大样本量
过拟合的原因是模型太努力的记住训练样本的分布状态,而增大样本容量,可以使得训练集的分布更加具有普适性,噪声对整体的影响下降。
#增大训练样本的容量
plot_learning_curve(LinearSVC(C=10),"linearSVC(C=10)",X,y,ylim=(0.8,1.01),
                   train_sizes=np.linspace(.1,1.0,5))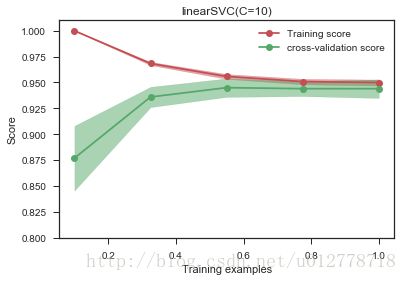
增大样本的容量可以使得训练误差和测试误差近似相等,虽然训练准确率较过拟合的低,但测试准确率在90%以上,大于过拟合的不到90%,有更好的泛化能力,更贴近现实。增大样本量,最直接的方法是想办法采集相同应用场景下的新数据,如果实在做不到,也可以在已有数据的基础上做一些人工的处理生成新数据(比如在图像识别中,我们可以对图像做旋转,镜像等等),当然,这样做有一定的风险,强烈建议采集真实的数据。
- 减少特征的量
比如,在之前的数据可视化表明,第11维和14维的数据对识别类别非常有用,我们可以只用它们。
#减少特征的量
plot_learning_curve(LinearSVC(C=10),"LinearSVC(C=10) Feature 11&14",X[:,[11,14]],y,ylim=(0.8,1.01),
                   train_sizes=np.linspace(0.2,1,5))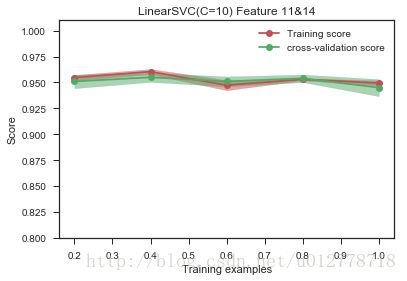
从上图中也可以看出,过拟合得到了缓解。不过这是我们观察后,手动选出11和14维。那能不能自动进行哪?也可以用遍历的方法进行特征选择(前提是维度不是很高,否则会非常耗时).
from sklearn.pipeline import Pipeline
from sklearn.feature_selection import SelectKBest,f_classif
#SelectKBest(f_classif,k=2)会根据Anova F-value选出最好的k=2个特征
plot_learning_curve(Pipeline([("fs",SelectKBest(f_classif,k=2)),#select  2 feature
                              ("svc",LinearSVC(C=10.0))]),
                    "SelectKBest(f_classif,k=2)+LinearSVC(C=10)",
                    X,y,ylim=(0.8,1.0),
                    train_sizes=np.linspace(0.05,0.2,5)
                   )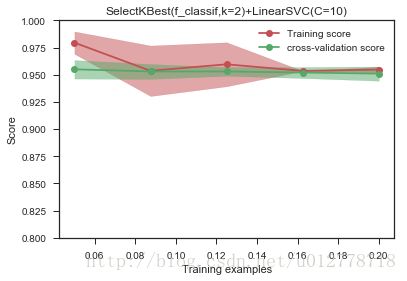
我们做特征选择,是想降低模型复杂度,而更不容易刻画噪声的分布。从这个角度(1)在多项式模型中减低多项式的次数(2)神经网络中减少层数和每层的节点数(3)SVM中增加RFB-kernel的band-width等方式来降低模型的复杂度。
我们不建议过拟合用减少特征的维数。
一般优先使用下面的方法:
- 增强正则化作用(这里说的是减少linearSVC中C的值)
正则化是最有效的降低过拟合的方法
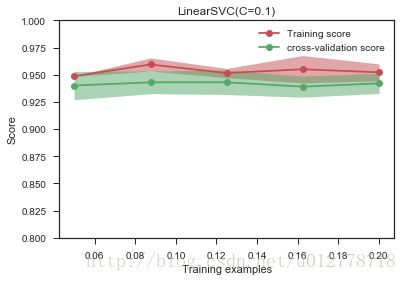
plot_learning_curve(LinearSVC(C=0.1),'LinearSVC(C=0.1)',X,y,ylim=(0.8,1),train_sizes=np.linspace(.05,0.2,5))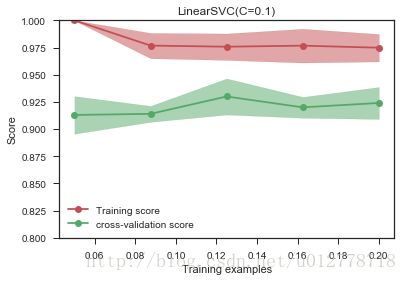
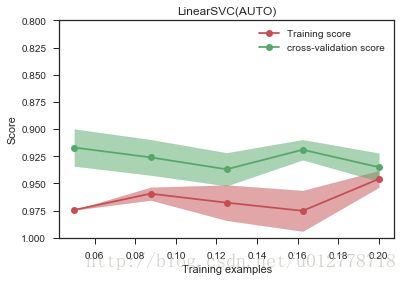
调整正则化系数,发现确实过拟合现象有一定的缓解,但依旧是哪个问题,我们的系数是自己敲定的,有没有办法可以自动选择参数?可以。我么可以在交叉验证集上做grid-search查找最好的正则化系数(对于大样本的数据,我们依旧需要考虑时间问题,这个过程可能有点慢):
from sklearn.grid_search import GridSearchCV
estm=GridSearchCV(LinearSVC(),
                 param_grid={"C":[0.001,0.01,0.1,1,10]})
plot_learning_curve(estm,"LinearSVC(AUTO)",
                   X,y,ylim={0.8,1.0},
                   train_sizes=np.linspace(.05,0.2,5))
print "Chosen params on 100 datapoints:%s"%estm.fit(X[:500],y[:500]).best_params_
Chosen params on 100 datapoints:{'C': 0.001}对于特征选择,我们sklearn.feature_selection中的SelectKBest来选择特征的过程,也提到了在高维的情况下,这个过程太慢了。那我们有别的方法进行特征选择吗?比如说我们的分类器能否甄别到哪些特征对最后的结果有益的?这里有个实际工作中用到的小技巧。
我们知道:
- L2正则化,它对于最后的权重影响是,尽量打算权值到每个维度上,不让权重集中到某些维度上,出现权重特别高的维度。
- L1正则化,它对于最后的权重影响是,让特征获得的权重稀疏化,也就是对结果影响不那么的特征,干脆就不拿权重。
基于这个理论,我们可以将SVC中L2正则化替换为L1正则化,让其自动甄别哪些权重应该留下权重。
plot_learning_curve(LinearSVC(C=0.1,penalty="l1",dual=False),"LinearSVC(C=0.1)",
X,y,ylim=(0.8,1),train_sizes=np.linspace(0.05,0.2,5))est=LinearSVC(C=0.1,penalty="l1",dual=False)
est.fit(X[:450],y[:450])#用450个点进行训练
print "Cofficients learned:%s"%est.coef_
print "Non-zero coefficients:%s"%np.nonzero(est.coef_)[1]得到结果:
Cofficients learned:[[  0.00000000e+00   0.00000000e+00   0.00000000e+00  -3.22356818e-02
   -1.66067083e-02   4.41395568e-03  -4.32411821e-02   3.85080374e-02
    0.00000000e+00   0.00000000e+00   6.27285423e-02   1.22238201e+00
    1.18925402e-01  -9.43028923e-04   0.00000000e+00   0.00000000e+00
    0.00000000e+00   0.00000000e+00   9.27597250e-02   0.00000000e+00]]
Non-zero coefficients:[ 3  4  5  6  7 10 11 12 13 18]
3 4 5 6 7 10 11 12 13 18维都获得了权重,18维的权重最大,说明它的影响最大。
- 欠拟合定位与解决
我们在随机生成一份数据[1000*20]的数据(但是分布和之前有变化),重新使用LinearSVC来做分类
#构造一份环形数据
from sklearn.datasets import make_circles
X,y=make_circles(n_samples=1000,random_state=2)
#绘出学习曲线
plot_learning_curve(LinearSVC(C=0.25),'LinearSVC(C=0.25)',X,y,ylim=(.5,1),train_sizes=np.linspace(.1,1,5))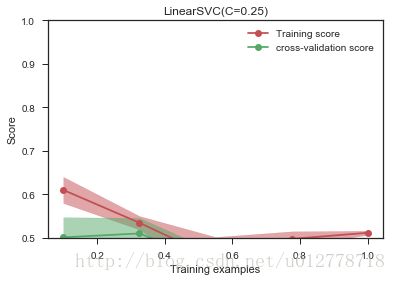
二分类问题,哪怕随机猜测,准确率也有0.5,这比随机猜测高不了多少。
不要盲目收集更多材料,或者调整正则化参数。我们从学习曲线上可以看到,训练集上的训练准确率和交叉验证集上的准确率都很低,这其实对应欠拟合状态。
我们回到我们的数据,可视化看看
f=DataFrame(np.hstack((X,y[:,None])),columns=range(2)+["class"])
_=sns.pairplot(df,vars=[0,1],hue="class",size=3.5)
plt.show()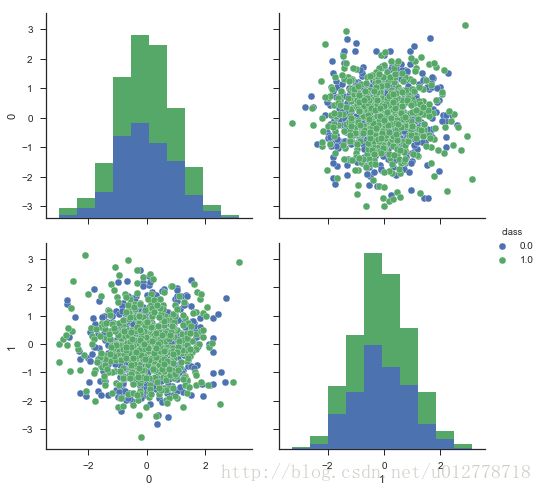
你会发现数据根本没法现行分割。所以你找更多的数据或调整正则化参数,都是无济于事的。
那如何解决欠拟合?
- 调整你的特征(找更有效的特征)
我们先对数据做个映射:
#加入原始特征的平方项作为新特征
X_extra=np.hstack((X,X[:,[0]]**2+X[:,[1]]**2))
plot_learning_curve(LinearSVC(C=0.25),"LinearSVC(C=0.25)",X_extra,y,ylim=(0.5,1),train_sizes=np.linspace(.1,1,5))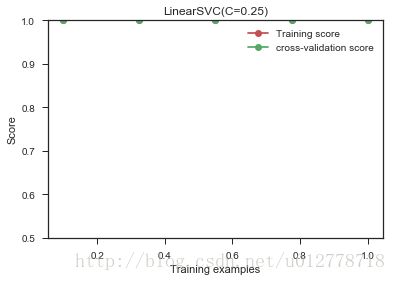
这说明选用特征对结果的准确率的影响很大,所以选用合适的特征是值得的。
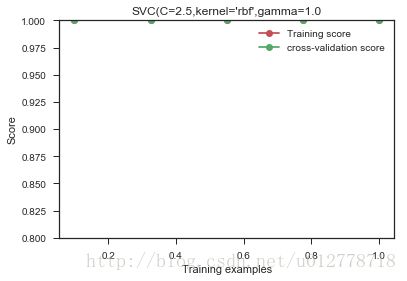
- 使用更复杂的模型(比如说非线性的核函数)
我们对模型稍微调整一下,用了一个复杂一些的非线性rbf kernel:
from sklearn.svm import SVC
#note:we use the original X without the extra featrue
plot_learning_curve(SVC(C=2.5,kernel='rbf',gamma=1.0),
                    "SVC(C=2.5,kernel='rbf',gamma=1.0"
,X,y,ylim=(0.8,1),train_sizes=np.linspace(.1,1,5))关于大数据样本集和高位特征空间
这次我们重新生成一份数据,但是这次,我们生成更多的数据,更高维的特征,而分类的类别数也是 5。
- 大数据情形下的模型选择和学习曲线
在上面的数据上如果用LinearSVC可能有点慢,在机器学习图谱中推荐使用SGDClassifier。就其本质,这个模型也是一个线性核函数的模型,不同的地方在于,它使用了随机梯度下降做训练,所以每次并没有使用全部的数据,收敛速度回快很多。SGDClassifier对特征的幅度非常敏感,因此在把数据灌给它之前,我们应该对幅度做调整,当然,用sklearn可以很方便的完成这点。
SGDClassifier每次只是用一部分的(mini-batch)做训练,在这种情况下,我们做交叉验证并不是很合适,我们会使用相应的progressIve validation:estimator每次只会拿下一个待训练batch在本次做评估,然后训练完之后,再在这个batch上做一个评估,看看是否有优化。
#生成大样本,高纬度的数据
X,y=make_classification(200000,n_features=200,n_informative=25,n_redundant=0,n_classes=10,class_sep=2,random_state=0)
#用SGDClassifier做训练,并画出batch在训练前后的得分差
from sklearn.linear_model import SGDClassifier
#est = SGDClassifier(penalty="l2", alpha=0.001)
est=SGDClassifier(penalty="l2",alpha=0.001)
progressive_validation_score=[]
train_scores=[]
for datapoint in range(0,199000,1000):
    X_batch=X[datapoint:datapoint+1000]
    y_batch=y[datapoint:datapoint+1000]
    if datapoint>0:
        progressive_validation_score.append(est.score(X_batch,y_batch))
    est.partial_fit(X_batch,y_batch,classes=range(10))
    if datapoint>0:
        train_scores.append(est.score(X_batch,y_batch))

plt.plot(train_scores,label="train score")
plt.plot(progressive_validation_score,label="progressive validation score")
plt.xlabel("Mini-batch")
plt.ylabel("score")
plt.legend(loc="best")
plt.show()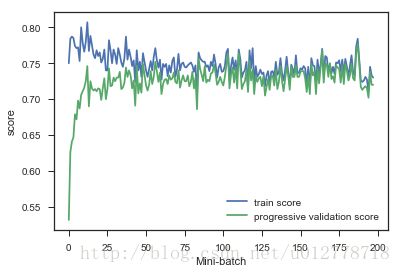
从上图可以看出,当batch大于50,数据上的得分已经变化不是很大了。但是得分都不是很高,我们猜测我们的数据处于欠拟合状态。如果在小的样本集上数据处于欠拟合我们可以使用更复杂的模型,比如把核函数设置为非线性的,但是遗憾的是像rbf核函数是没办法和SGDClassifier是不兼容的。在这里我们可以将SGDClassifier替换掉,使用多层感知神经网络来完成这个任务,我们之所以会想到多层感知神经网,是因为它也是一个随机梯度下降训练的算法,同时也是一个非线性模型。根据机器学习知识图谱,也可以使用核估计(kernel approximation)来完成这个事情。
大数据量下的数据可视化
大样本数据的可视化是一个相对比较麻烦的事情,一般我们都要用到降维的方法先处理特征。我们的数据集去经典的“手写数字集”
#直接从sklearn中load数据集
from sklearn.datasets import load_digits
digits=load_digits(n_class=6)
X=digits.data
y=digits.target
n_samples,n_features=X.shape
print "dataset consit of %d sample with %d feature each"%(n_samples,n_features)

#绘制数字示意图
n_img_per_row=20
img=np.zeros((10*n_img_per_row,10*n_img_per_row))
for i in range(n_img_per_row):
    ix=10*i+1
    for j in range(n_img_per_row):
        iy=10*j+1
        #img[ix:ix+8,iy:iy+8]=X[i*n_img_per_row+j].reshape((8,8))
        #print img[ix:ix + 8, iy:iy + 8].shape
        #print  X[i * n_img_per_row + j].reshape((8, 8))
        img[ix:ix + 8, iy:iy + 8] = X[i * n_img_per_row + j].reshape((8, 8))


plt.imshow(img,cmap=plt.cm.binary)
plt.xticks([])
plt.yticks([])
_=plt.title("A selection from the 8*8=64-dimensional digits dataset")
plt.show()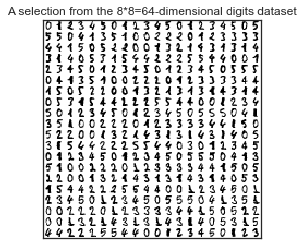
我们总共有1083个训练样本,包含手写数字(0,1,2,3,4,5),每个样本图片中的像素点平铺开都是64位,这个维度显然是没办法可视化的。
下面我们基于sklearn示例 对特征做降维处理,再可视化。
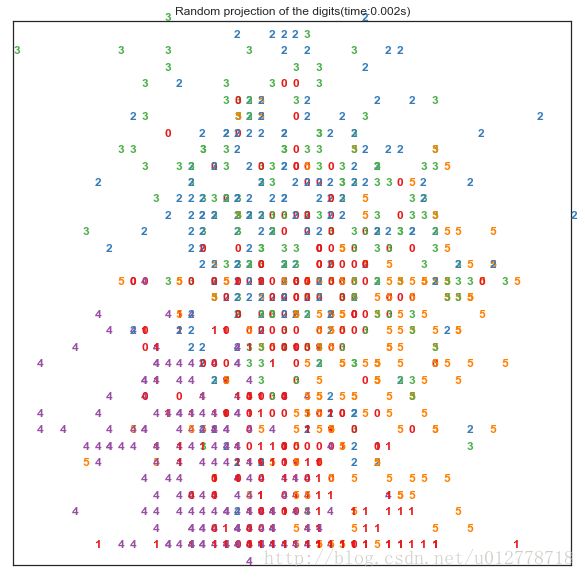
随机投射
我们先看看将数据随机投射到任意两个维度上的结果:
#import所需的包
from sklearn import (manifold,decomposition,random_projection)
import time
rp=random_projection.SparseRandomProjection(n_components=2,random_state=42)
#定义绘制函数
from matplotlib import offsetbox
def plot_embedding(X,title=None):
    x_min,x_max=np.min(X,0),np.max(X,0)
    X=(X-x_min)/(x_max-x_min)

    plt.figure(figsize=(10,10))
    ax=plt.subplot(111)
    for i in range(X.shape[0]):
        plt.text(X[i,0],X[i,1],str(digits.target[i]),
                color=plt.cm.Set1(y[i]/10.),
                fontdict={'weight':'bold','size':'12'})

    if hasattr(offsetbox,'AnnotationBbpx'):
        #only print thumbnails with matplotlib>1.
        shown_images=np.array([[1.,1.]])#just something big
        for i in range(digits.data.shape[0]):
            dist=np.sum((X[i]-shown_images)**2,1)
            if np.min(dist)<4e-3:
                #do not show points that are too colse
                continue
            shown_images=np.r_[show_images,[X[i]]]
            imagebox=offsetbox.AnnotionBox(
            offsetbox.OffsetImage(digits.images[i],cmap=plt.cm.gray_r),
            X[i])
            ax.add_artist(iamgebox)
    plt.xticks([]),plt.yticks([])
    if title is not None:
        plt.title(title)

#记录开始的时间
start_time=time.time()
X_projection=rp.fit_transform(X)
plot_embedding(X_projection,"Random projection of the digits(time:%.3fs)"%(time.time()-start_time))
plt.show()
PCA降维
在降维领域有一个非常强大的算法叫做PCA(主成分分析),它将原始的绝大多数信息用维度远低于原始维度的几个主成分表示出来。PCA在数据集效果换不错,我们来看看用PCA对原始特征将维到2维后,原始样本在空间中的分布状况:
from sklearn import (manifold,decomposition,random_projection)
#TruncateeSVD是PCA的一种实现
X_pca=decomposition.TruncatedSVD(n_components=2).fit_transform(X)
#记录时间
start_time=time.time()
plot_embedding(X_pca,"pca of the digits time:%fs"%(time.time()-start_time))
plt.show()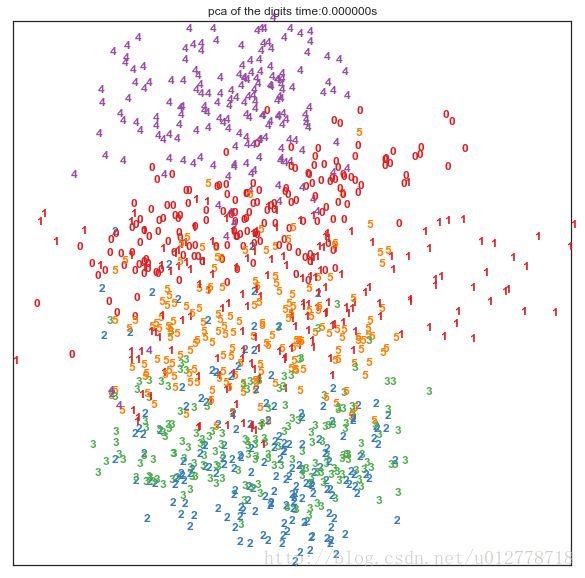
可以看出效果换不错,不同的手写数字在2维平面上,显示出区域集中性。即使他们有一定的区域重合。
如果我们用一些非线性变换来做降维操作,从原始的64维降到2维,效果会更好,比如这里我们用到一个技术叫做t-SNE,sklearn的manifold对其做了实现:
#降维
tsne=manifold.TSNE(n_components=2,init='pca',random_state=0)
start_time=time.time()
X_tsne=tsne.fit_transform(X)
#绘图
plot_embedding(X_tsne,"t-TSNE of the digits time:%.3fs"%(time.time()-start_time))
plt.show()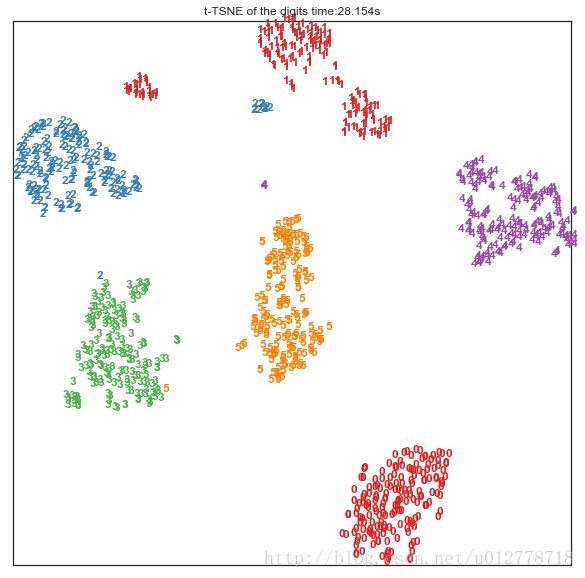
效果非常惊人,似乎仅仅经过非线性的降维就可以将数据在平面上很好的分开。t-SNE相对于线性的降维需要更多的时间,不太适合在大数据全集上使用。
损失函数的选择
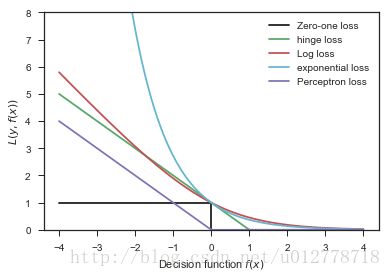
损失函数的选择对于问题的优化和解决,非常重要。我们先看一下各种不同的损失函数
xmin,xmax=-4,4
xx=np.linspace(xmin,xmax,100)
plt.plot([xmin,0,0,xmax],[1,1,0,0],'k-',label='Zero-one loss')
plt.plot(xx,np.where(xx<1,1-xx,0),'g-',label='hinge loss')
plt.plot(xx,np.log2(1+np.exp(-xx)),'r-',label='Log loss')
plt.plot(xx,np.exp(-xx),'c-',label='exponential loss')
plt.plot(xx,-np.minimum(xx,0),'m-',label='Perceptron loss')

plt.ylim(0,8)
plt.legend(loc="upper right")
plt.xlabel(r"Decision function $f(x)$")
plt.ylabel("$L(y,f(x))$")
plt.show()- 0-1损失函数(zero-one loss),直接判断分类中判错的个数。但是它是一个非凸函数
- hinge loss的健壮性相对较高,(对于异常点,噪声不是很敏感)。但是它没有那么好的概率解释
- log损失函数(log-loss)的结果能非常好的表征概率分布。因此在很多场景,尤其是多分类的场景下,如果我们需要知道每个类别的置信度,那么这个损失函数非常合适。缺点是它的健壮性没那么强,相对hinge loss会对噪声更敏感些。
- 指数损失函数(exponential loss)(Adboost中用到)对离群点非常非常敏感,但是它的形式对boost算法简单而有效。
- 感知损失(perceptron loss)可以看做是hinge loss的一个变种。hinge loss对于判定边界点的惩罚很高。而感受损失,只要样本的判定类别正确,它就是满意的,而不管其离判定边界的距离。优点是比较简单,缺点是因为不是max-margin boundary,所以得到模型的泛化能力没有hinge loss的强。
