alphalens教程2--基于return的因子分析
广告:本人的单因子测试视频教程https://edu.csdn.net/course/detail/25572
上次,我们利用get_clean_factor_and_forward_returns这个函数,可以获得alphalens能够接受的一种factor数据,接下来,我们就是利用这个函数返回给我们的数据去进行因子的分析。我们队这个函数的返回值命名为factor_data,即factor_date = get_clean_factor_and_forward_returns(......)。
今天我们主要基于return来分析,也就是说,是因子收益率分析。
1.获得因子平均收益率数据
因子收益率分析的第一个函数定义如下:
def mean_return_by_quantile(factor_data,
                            by_date=False,
                            by_group=False,
                            demeaned=True):
参数解释
factor_data : pd.DataFrame - MultiIndex
这个就是我们用整理好的数据产生的的factor_data。
by_date : bool
是否按天计算收益率
by_group : bool
是否按组别来计算收益率
demeaned : bool
是否是计算超额收益(或者说,是某种group后的中性收益)
返回值
mean_ret : pd.DataFrame
收益率的均值
std_error_ret : pd.DataFrame
收益率的方差
使用方法demo:
mean_return_by_q_daily, std_err = alphalens.performance.mean_return_by_quantile(factor_data, by_date=True)
factor_data是上次的那个函数整合的因子数据。
两个return的结果如下:
mean_return_by_q_group, std_err = alphalens.performance.mean_return_by_quantile(factor_data, by_group =True)
当然,我们也可以不分组。
mean_return_by_q, std_err = alphalens.performance.mean_return_by_quantile( factor_data)
2.绘制均值收益的直方图
把上面获得的第一个参数,也就是mean_return_by_q这一类作为参数,传给alphalens.plotting.plot_quantile_returns_bar(mean_return_by_q)。
def plot_quantile_returns_bar(mean_ret_by_q,
                              by_group=False,
                              ylim_percentiles=None,
                              ax=None):
参数解释
mean_ret_by_q : pd.DataFrame
上一步获得的数据,可以是分组后的,也可以没有分组的,一般建议不分组或者按照行业分组
by_group : bool
如果mean_ ret的数据是安按照group分组的,那么这里也需要设置为True.
ylim_percentiles : tuple of integers
y轴的参数设置
ax : matplotlib.Axes, optional
matplotlib的ax句柄
返回值:
ax : matplotlib.Axes
笔者尝试了一下按行业分,效果大概如下吗,每个行业,五层因子值中每层在不同周期下的收益率均值的直方图。
上面的按日期算均值的mean_ret有一个美丽的用法,就是结合alphalens.plotting.plot_quantile_returns_violin绘制提琴图。
alphalens.plotting.plot_quantile_returns_violin(mean_return_by_q_daily)
3.收益率差值图
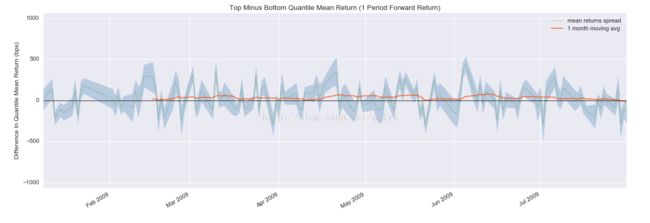
同样的逻辑,先产生数据,然后绘图。这次绘制的是收益率差值图,也就是说,是好的因子层的收益率减去最差的因子层的收益率。
def compute_mean_returns_spread(mean_returns,
                                upper_quant,
                                lower_quant,
                                std_err=None):
参数解释
----------
mean_returns : pd.DataFrame
之前获得的,我们使用的是daily的
upper_quant : int
高收益的因子层序号
lower_quant : int
低收益的因子层序号
std_err : pd.DataFrame
之前生成的标准差
返回值
-------
mean_return_difference : pd.Series
收益率差值数据
joint_std_err : pd.Series
差值的标准误
画图的函数如下
def plot_mean_quantile_returns_spread_time_series(mean_returns_spread,
                                                  std_err=None,
                                                  bandwidth=1,
                                                  ax=None):
参数说明:
----------
mean_returns_spread : pd.Series
上一个函数获得的数据
std_err : pd.Series
上一个函数获得的标准误
bandwidth : float
带宽,就是布林带带宽的概念,在图上绘制多少倍的标准误作为带宽
ax : matplotlib.Axes, optional
ax句柄
返回值
-------
ax : matplotlib.Axes
图片的ax句柄
使用demo:
quant_return_spread, std_err_spread = alphalens.performance.compute_mean_returns_spread(mean_return_by_q_daily,
upper_quant=5,
lower_quant=1,
std_err=std_err_daily)
alphalens.plotting.plot_mean_quantile_returns_spread_time_series(quant_return_spread, std_err_spread)
绘制出来的效果如下:
4.各层因子累计收益率图
对于一个因子,我们希望好的分层和差的分层的收益率有很大的差别,也就是说,因子的区分度越好,我们越觉得因子有效。下面这个函数能够计算出不同分层下的投资累计收益回报。随着时间曲线发散,越发散,说明因子越有效。
def plot_cumulative_returns_by_quantile(quantile_returns, period=1, ax=None): 参数解释:
quantile_returns : pd.DataFrame
之前的回报率数据
period: int, optional
计算回报率的周期
ax : matplotlib.Axes, optional
ax句柄
Returns
图片的ax句柄
5.cash-netural 方法
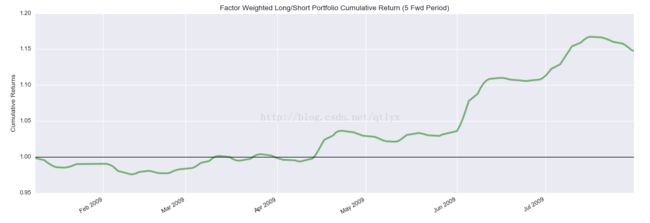
还有一种因子测试方法,就是以因子值为权重,做多高收益率的因子层股票,最空低收益率的因子层股票,获得相对收益。
同样的逻辑,先获得数据:
def factor_returns(factor_data, long_short=True, group_neutral=False):
参数:
factor_data : pd.DataFrame - MultiIndex
之前一开始就获得的数据
long_short : bool
是否进行多空组合计算
group_neutral : bool
是否group中性,由于group通常是行业,所以,是否是行业中性。如果中性,那么,每个group内部将会进行配权重。
返回值:
-------
returns : pd.DataFrame
dollar neutral portfolio weighted by factor value的收益率。
示例demo:
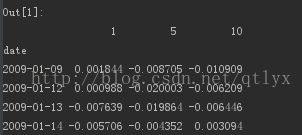
ls_factor_returns = alphalens.performance.factor_returns(factor_data)
ls_factor_returns 的值如下:
alphalens.plotting.plot_cumulative_returns(ls_factor_returns[1])
alphalens.plotting.plot_cumulative_returns(ls_factor_returns[5], period=5)
分别绘制调仓周期为天的周的cash-netural investment的收益率曲线。
6.alpha and beta value
我们知道,alpha策略的理论根据是capm模型,所以,我们最后计算一下每一个调仓下的alpha和beta值
alpha_beta = alphalens.performance.factor_alpha_beta(factor_data)
alpha_beta的数值如下:
7.整个函数
以上所有图片,我们可以用以下两句话来解决,这是alphalens里面常有的特性。
alphalens.tears.create_returns_tear_sheet(factor_data)
plt.show()


