智慧城市赛道之房产租金预测(一)
房产租金预测共分为6个阶段,任务概览:
赛 题 分 析 → 赛题分析\to 赛题分析→ 数 据 清 洗 → 数据清洗\to 数据清洗→ 特 征 工 程 → 特征工程\to 特征工程→ 模 型 选 择 → 模型选择\to 模型选择→ 模 型 融 合 → 模型融合\to 模型融合→ 比 赛 整 理 比赛整理 比赛整理
这里,我们分阶段进行讨论,每次进行一个。
赛题分析
文章目录
- 赛题分析
- 一、比赛背景
- 二、数据集字段说明
- 二、探索性数据分析EDA
- 1. 缺失值分析
- 2. 特征和与预测值关联性分析
- 3. 特征nunique分布
- 3.1 出现在测试集中的commuity,但在训练集中很少
- 3.2 统计特征值出现频次大于100的特征
- 4. Label分布
- 4.1. 因变量 tradeMoney 分布
- 4.2. 分类数据 category feature 的分布
一、比赛背景
近几年,国内住房租赁市场进入全新的发展阶段,长期公寓市场作为租赁市场的重要部分,越来越受到广泛的关注。但同时中国长期公寓市场也面临着企业市场进入、业务(门店)扩张、资本市场博弈、企业重组并购等多重挑战,其中,如何准确的预测租金便成为该行业发展进程中的一大难题。
本次赛题主要是通过房产市场、租赁市场、市场需求以及房屋配置来做出合理的房租预测,以应对市场变化对运营商和房产机构带来的影响。命题方向为运用机器学习、人工智能等模型算法,结合模型的创新能力,来实现准确预测的目的。
二、数据集字段说明
- 对于小区信息中,关于city、region、plate三者的关系:city>region>plate
- 土地数据中,土地楼板面积是指在土地上建筑的房屋总面积
- 相关类别及说明:
1.租赁房源:
ID——房屋编号 数值型
area——房屋面积 数值型
rentType——出租方式:整租/合租/未知 类别型
houseType——房型 类别型
houseFloor——房间所在楼层:高/中/低 类别型
totalFloor——房间所在的总楼层数 数值型
houseToward——房间朝向 类别型
houseDecoration——房屋装修 类别型
2.小区信息:
CommunityName——小区名称 类别型
city——城市 类别型
region——地区 类别型
plate——区域板块 类别型
buildYear——小区建筑年代 类别型
saleSecHouseNum——该板块当月二手房挂牌房源数 数值型
3.配套设施:
subwayStationNum——该板块地铁站数量 数值型
busStationNum——该板块公交站数量 数值型
interSchoolNum——该板块国际学校的数量 数值型
schoolNum——该板块公立学校的数量 数值型
privateSchoolNum——该板块私立学校数量 数值型
hospitalNum——该板块综合医院数量 数值型
DrugStoreNum——该板块药房数量 数值型
gymNum——该板块健身中心数量 数值型
bankNum——该板块银行数量 数值型
shopNum——该板块商店数量 数值型
parkNum——该板块公园数量 数值型
mallNum——该板块购物中心数量 数值型
superMarketNum——该板块超市数量 数值型
4.二手房:
totalTradeMoney——该板块当月二手房成交总金额 数值型
totalTradeArea——该板块二手房成交总面积 数值型
tradeMeanPrice——该板块二手房成交均价 数值型
tradeSecNum——该板块当月二手房成交套数 数值型
5.新房:
totalNewTradeMoney——该板块当月新房成交总金额 数值型
totalNewTradeArea——该板块当月新房成交的总面积 数值型
totalNewMeanPrice——该板块当月新房成交均价 数值型
tradeNewNum——该板块当月新房成交套数 数值型
remainNewNum——该板块当月新房未成交套数 数值型
supplyNewNum——该板块当月新房供应套数 数值型
6.土地:
supplyLandNum——该板块当月土地供应幅数 数值型
supplyLandArea——该板块当月土地供应面积 数值型
tradeLandNum——该板块当月土地成交幅数 数值型
tradeLandArea——该板块当月土地成交面积 数值型
landTotalPrice——该板块当月土地成交总价 数值型
landMeanPrice——该板块当月楼板价(元/ m 2 m^{2} m2) 数值型
7.人口:
totalWorkers——当前板块现有的办公人数 数值型
newWorkers——该板块当月流入人口数(现招聘的人员) 数值型
residentPopulation——该板块常住人口 数值型
8.客户:
pv——该板块当月租客浏览网页次数 数值型
uv——该板块当月租客浏览网页总人数 数值型
lookNum——线下看房次数 数值型
9.真实租金:
tradeTime——成交日期 类别型
tradeMoney——成交租金 数值型
二、探索性数据分析EDA
加载包
import pandas as pd
import numpy as np
import matplotlib.pyplot as plt
import seaborn as snn
from scipy.stats import norm
获取数据
##--Load train data and test data--
train_df = pd.read_csv('train_data.csv')
test_df = pd.read_csv('test_a.csv')
1. 缺失值分析
#train_df.info()
combine = [train_df,test_df]
for dataSet in combine:
    Total = dataSet.isnull().sum().sort_values(ascending=False)
    Percent = Total/dataSet.isnull().count()
    Missing_count = pd.concat([Total,Percent],axis=1,keys=['Total','Percent'],sort=False)
    print(Missing_count.head(2))
    print('--------------------')
结果:
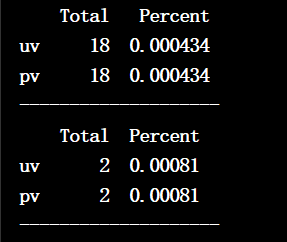
我们可以看到:pv和uv都有少量的缺失值,其中pv表示该板块当月租客浏览网页次数,uv表示该板块当月租客浏览网页总人数 。这里,我们可以使用均值,中位数,众数等简单的方法进行填充。
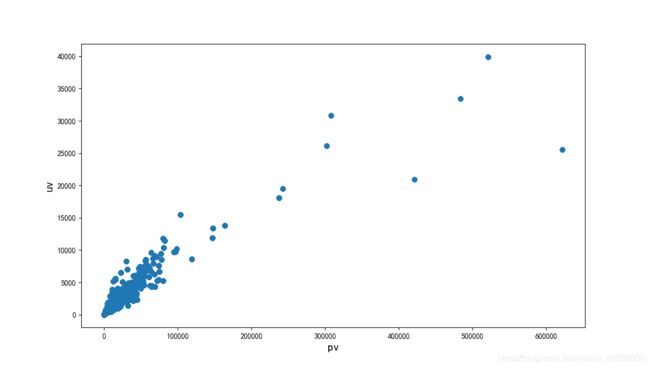
但是,通过散点图分析,这两个点有很强的的关联,故可以用一个特征来表示:
2. 特征和与预测值关联性分析
本来我想利用相关性分析,找出与要预测的变量tradeMoney关联较大的变量,在画出散点图,直观表示的,结果。。。
corr_mat = train_df.corr()
fig,ax = plt.subplots(figsize = (30,20))
snn.heatmap(corr_mat,vmax=.8,square=True,ax=ax,cmap='YlGnBu')
plt.xticks(rotation = 90)
plt.yticks(rotation = 0)
plt.show()
结果:
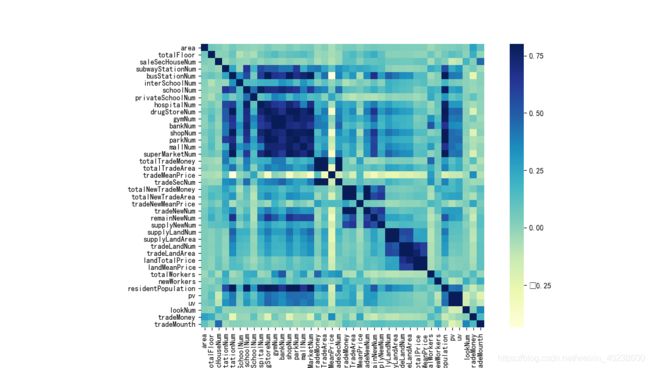
好像关联性都不是很强。。。数据非常不好,很 “脏”。
3. 特征nunique分布
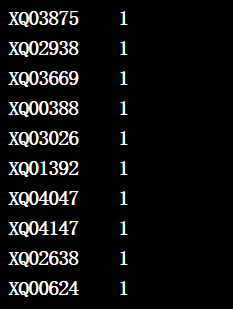
3.1 出现在测试集中的commuity,但在训练集中很少
train_community = train_df['communityName'].value_counts().sort_values(ascending=True)
test_community =  test_df['communityName'].value_counts()
print(train_community.head(10))
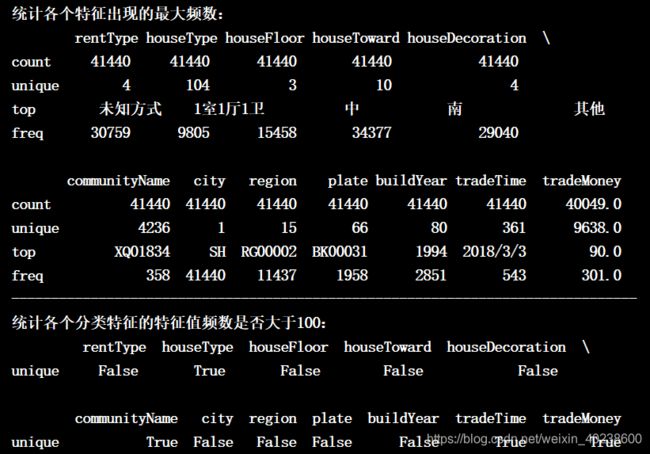
3.2 统计特征值出现频次大于100的特征
feature_frency=train_df.describe(include=['O'])
print('统计各个特征出现的最大频数:\n', feature_frency)
print('-------------------------------------------------------------------------------')
print('统计各个分类特征的特征值频数是否大于100:\n',feature_frency[feature_frency.index=='unique'].apply(lambda x:x>100))
4. Label分布
先对明显的outlier做了处理,
Q1 = train_df['tradeMoney'].quantile(q=0.75)
Q2 = train_df['tradeMoney'].quantile(q=0.25)
train_df= train_df[(train_df['tradeMoney']Q2-3*(Q1-Q2))]

Q11 = train_df['area'].quantile(q=0.75)
Q12 = train_df['area'].quantile(q=0.25)
train_df= train_df[(train_df['area']Q12-3*(Q11-Q12))]

Q21 = test_df['area'].quantile(q=0.75)
Q22 = test_df['area'].quantile(q=0.25)
test_df= test_df[(test_df['area']Q22-3*(Q21-Q22))]
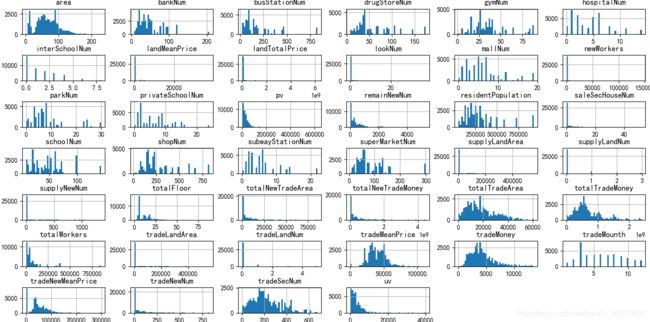
观察训练集和测试集中的样本分布,
train_df.hist(bins=50,figsize=(15,10))
plt.tight_layout(pad=0.5)
plt.show()
 train_df.hist(bins=50,figsize=(15,10))
 plt.tight_layout(pad=0.5)
 plt.show()
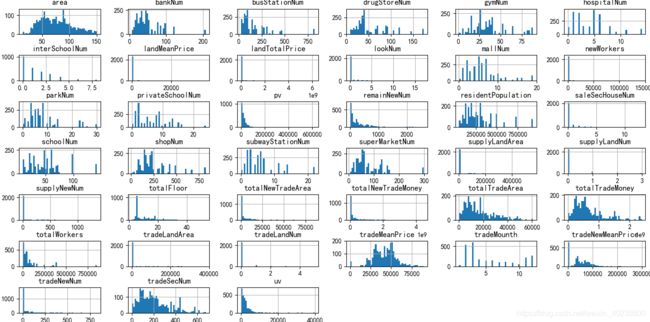
经过简单的异常值处理以后,可以看出,训练集和测试集特征分布大体相同。
4.1. 因变量 tradeMoney 分布
fig,ax = plt.subplots(figsize=(12,9))
snn.distplot(train_df['tradeMoney'],fit=norm,ax=ax)
plt.show()
结果:
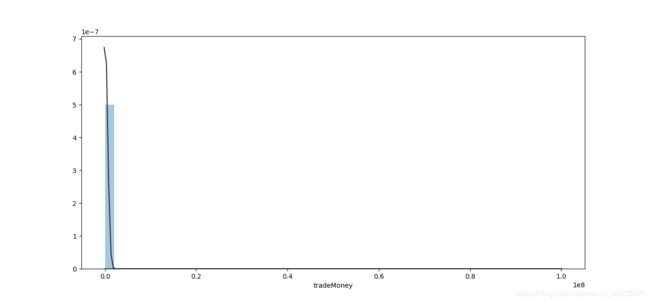
数据存在明显的 outlier,本来应该先清洗一下的,但按照流程是放在第二部分的。
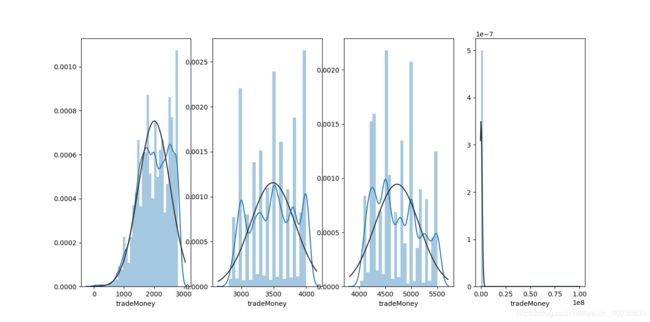
将Label进行切分,
pd.qcut(train_df['tradeMoney'],q=4)
对切分的四份数据进行分析,
tradeMoney_1 = train_df.loc[train_df['tradeMoney']<=2800,'tradeMoney']
tradeMoney_2 = train_df.loc[(train_df['tradeMoney']>2800)&(train_df['tradeMoney']<=4000),'tradeMoney']
tradeMoney_3 = train_df.loc[(train_df['tradeMoney']>4000)&(train_df['tradeMoney']<=5500),'tradeMoney']
tradeMoney_4 = train_df.loc[train_df['tradeMoney']>5500,'tradeMoney']
fig,(ax1,ax2,ax3,ax4) = plt.subplots(1,4,figsize=(30,20))
snn.distplot(tradeMoney_1,fit=norm,ax=ax1)
snn.distplot(tradeMoney_2,fit=norm,ax=ax2)
snn.distplot(tradeMoney_3,fit=norm,ax=ax3)
snn.distplot(tradeMoney_4,fit=norm,ax=ax4)
plt.show()
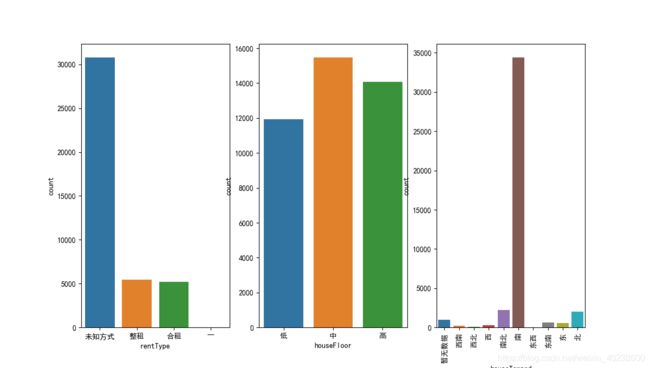
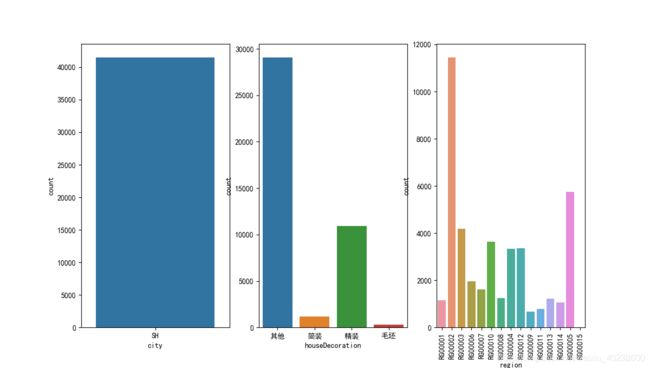
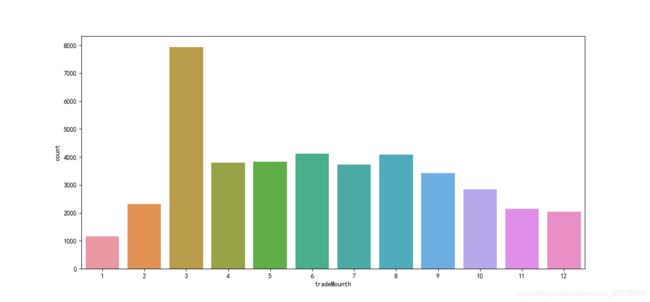
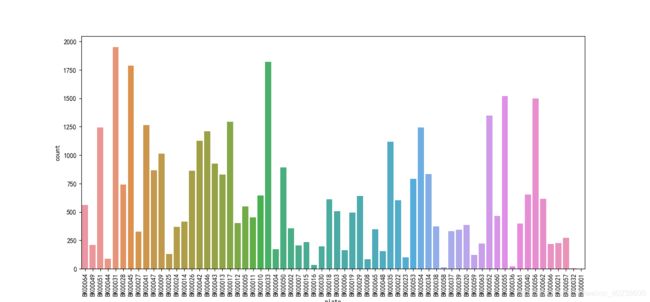
4.2. 分类数据 category feature 的分布
train_df['tradeMounth'] = train_df['tradeTime'].apply(lambda x:int(x.split('/')[1]))
