%matplotlib inline
import matplotlib.pyplot as plt
import numpy as np
import pandas as pd
# 加载数据
data = pd.read_csv('datasets/pima-indians-diabetes/diabetes.csv')
print('dataset shape {}'.format(data.shape))
data.head()

data.groupby("Outcome").size()
Outcome
0    500
1    268
dtype: int64
X = data.iloc[:, 0:8]
Y = data.iloc[:, 8]
print('shape of X {}; shape of Y {}'.format(X.shape, Y.shape))
shape of X (768, 8); shape of Y (768,)
#随机种子的作用是让每次实验产生的数据相同
from sklearn.model_selection import train_test_split
X_train, X_test, Y_train, Y_test = train_test_split(X, Y, test_size=0.2,random_state=0);
from sklearn.neighbors import KNeighborsClassifier, RadiusNeighborsClassifier

models = []
models.append(("KNN", KNeighborsClassifier(n_neighbors=2)))
models.append(("KNN with weights", KNeighborsClassifier(
    n_neighbors=2, weights="distance")))
models.append(("Radius Neighbors", RadiusNeighborsClassifier(
    n_neighbors=2, radius=500.0)))
results = []
for name, model in models:
    model.fit(X_train, Y_train)
    results.append((name, model.score(X_test, Y_test)))
for i in range(len(results)):
    print("name: {}; score: {}".format(results[i][0],results[i][1]))
name: KNN; score: 0.7142857142857143
name: KNN with weights; score: 0.6168831168831169
name: Radius Neighbors; score: 0.6948051948051948
#多次随机分配训练集和交叉验证数据集,然后求模型准确度评分的平均值
from sklearn.model_selection import KFold
from sklearn.model_selection import cross_val_score
results = []
for name, model in models:
    kfold = KFold(n_splits=10)
    cv_result = cross_val_score(model, X, Y, cv=kfold)
    results.append((name, cv_result))
for i in range(len(results)):
    print("name: {}; cross val score: {}".format(
        results[i][0],results[i][1].mean()))
name: KNN; cross val score: 0.7147641831852358
name: KNN with weights; cross val score: 0.6770505809979495
name: Radius Neighbors; cross val score: 0.6497265892002735
模型训练
knn = KNeighborsClassifier(n_neighbors=2)
knn.fit(X_train, Y_train)
train_score = knn.score(X_train, Y_train)
test_score = knn.score(X_test, Y_test)
print("train score: {}; test score: {}".format(train_score, test_score))
train score: 0.8289902280130294; test score: 0.7142857142857143
from sklearn.model_selection import ShuffleSplit
from sklearn.model_selection import learning_curve
# from common.utils import plot_learning_curve

# knn = KNeighborsClassifier(n_neighbors=2)

# cv = ShuffleSplit(n_splits=10, test_size=0.2, random_state=0)
# plt.figure(figsize=(10, 6))
# plot_learning_curve(plt, knn, "Learn Curve for KNN Diabetes",
#                     X, Y, ylim=(0.0, 1.01), cv=cv);
def plot_learning_curve(estimator, title, X, y, ylim=None, cv=None,
                        n_jobs=None, train_sizes=np.linspace(.1, 1.0, 5)):
    plt.figure()
    plt.title(title)
    if ylim is not None:
        plt.ylim(*ylim)
    plt.xlabel("Training examples")
    plt.ylabel("Score")
    train_sizes, train_scores, test_scores = learning_curve(
        estimator, X, y, cv=cv, n_jobs=n_jobs, train_sizes=train_sizes)
    train_scores_mean = np.mean(train_scores, axis=1)
    train_scores_std = np.std(train_scores, axis=1)
    test_scores_mean = np.mean(test_scores, axis=1)
    test_scores_std = np.std(test_scores, axis=1)
    plt.grid()

    plt.fill_between(train_sizes, train_scores_mean - train_scores_std,
                     train_scores_mean + train_scores_std, alpha=0.1,
                     color="r")
    plt.fill_between(train_sizes, test_scores_mean - test_scores_std,
                     test_scores_mean + test_scores_std, alpha=0.1, color="g")
    plt.plot(train_sizes, train_scores_mean, 'o-', color="r",
             label="Training score")
    plt.plot(train_sizes, test_scores_mean, 'o-', color="g",
             label="Cross-validation score")

    plt.legend(loc="best")
    return plt
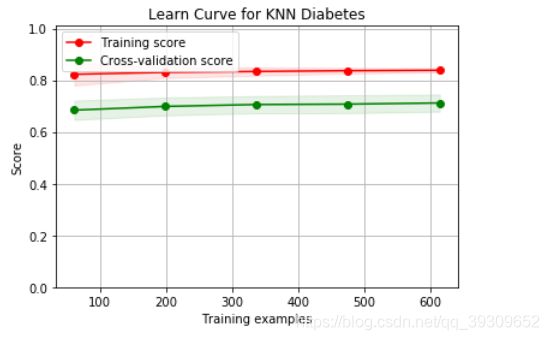
title = "Learn Curve for KNN Diabetes"
# Cross validation with 100 iterations to get smoother mean test and train
# score curves, each time with 20% data randomly selected as a validation set.
cv = ShuffleSplit(n_splits=100, test_size=0.2, random_state=0)
estimator =KNeighborsClassifier(n_neighbors=2)
plt.figure(figsize=(18, 4))
plot_learning_curve(estimator, title, X, Y, ylim=(0.0, 1.01), cv=cv, n_jobs=4)
plt.show()

数据可视化
from sklearn.feature_selection import SelectKBest

selector = SelectKBest(k=2)
X_new = selector.fit_transform(X, Y)
X_new[0:5]
array([[148. ,  33.6],
       [ 85. ,  26.6],
       [183. ,  23.3],
       [ 89. ,  28.1],
       [137. ,  43.1]])
results = []
for name, model in models:
    kfold = KFold(n_splits=10)
    cv_result = cross_val_score(model, X_new, Y, cv=kfold)
    results.append((name, cv_result))
for i in range(len(results)):
    print("name: {}; cross val score: {}".format(
        results[i][0],results[i][1].mean()))
name: KNN; cross val score: 0.725205058099795
name: KNN with weights; cross val score: 0.6900375939849623
name: Radius Neighbors; cross val score: 0.6510252904989747
选择四个特征
from sklearn.feature_selection import SelectKBest

selector = SelectKBest(k=2)
X_new = selector.fit_transform(X, Y)
results = []
for name, model in models:
    kfold = KFold(n_splits=10)
    cv_result = cross_val_score(model, X_new, Y, cv=kfold)
    results.append((name, cv_result))
for i in range(len(results)):
    print("name: {}; cross val score: {}".format(
        results[i][0],results[i][1].mean()))
name: KNN; cross val score: 0.725205058099795
name: KNN with weights; cross val score: 0.6900375939849623
name: Radius Neighbors; cross val score: 0.6510252904989747
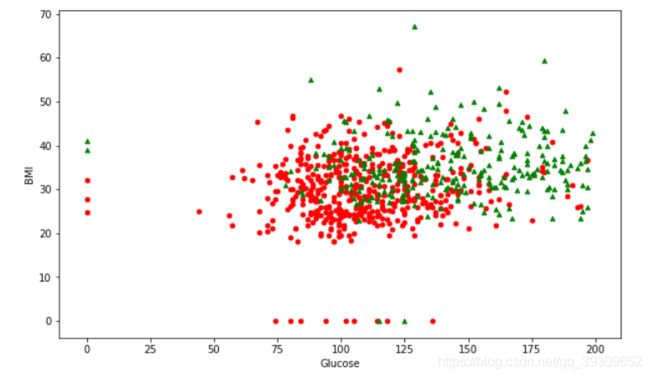
# 画出数据
plt.figure(figsize=(10, 6))
plt.ylabel("BMI")
plt.xlabel("Glucose")
plt.scatter(X_new[Y==0][:, 0], X_new[Y==0][:, 1], c='r', s=20, marker='o');         # 画出样本
plt.scatter(X_new[Y==1][:, 0], X_new[Y==1][:, 1], c='g', s=20, marker='^');         # 画出样本


