MATLAB程序设计-4.三维绘图
一般来说,三维绘图主要用于显示两种类型的数据。
- 两个变量是同一个独立变量的函数,且此时需要强调独立变量的重要性。
- 单变量是两个独立变量的函数。
三维线绘图
% 考虑函数 x(t)=e^{
     -0.2t}cos2t与y(t)=e^{
     -0.2t}sin2t代表一个机械系统在两个维度上的衰减振荡,
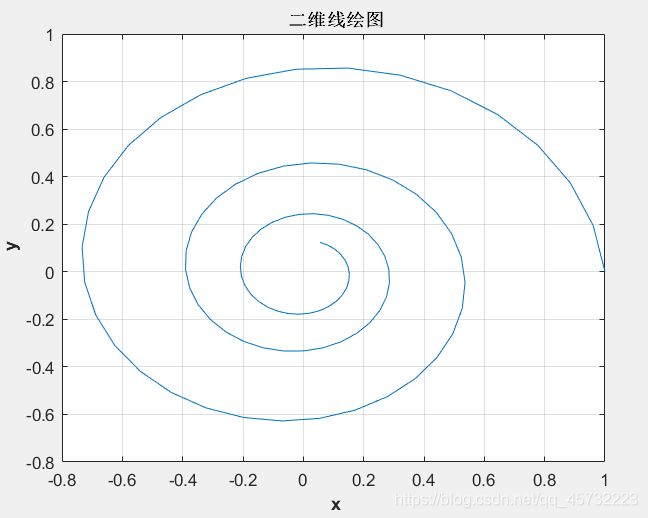
% 因此x和y表示在任何给定时间的系统位置。这里,x和y是相同独立变量t的函数。
t = 0:0.1:10;
x = exp(-0.2*t).*cos(2*t);
y = exp(-0.2*t).*sin(2*t);
% 1.使用二维绘图函数plot绘制,时间对系统行为的重要性无法凸显;
figure;
plot(x,y); title('\bf 二维线绘图'); xlabel('\bf x'); ylabel('\bf y');
grid on;
% 2.函数plot3绘制变量时可以保留时间信息以及对象的二维位置.
figure;
plot3(x,y,t); title('\bf 三维线绘图'); xlabel('\bf x'); ylabel('\bf y'); zlabel('\bf time');
grid on;
三维曲面、网格和等高线绘图
任何具有两个独立变量的函数都可以在三维曲面、网格或等高线绘图上显示。
mesh(x,y,z)—创建网格或线框绘图;surf(x,y,z)—创建曲面绘图;contour(x,y,z)—创建等高线绘图。
1、使用嵌套循环语句创建三个数组并进行网格绘图
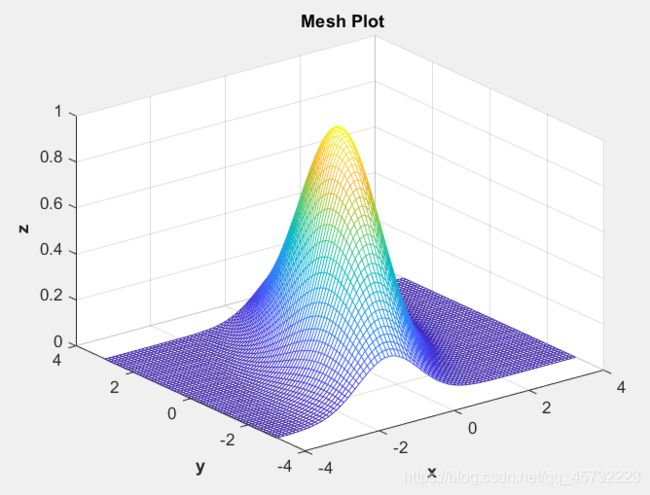
% 创建如下函数的网格绘图 z(x,y)=e^{
     -0.5*(x^2+0.5(x-y)^2)}
% 其中 -4<=x<=4,-3<=y<=3,取值间隔为0.1。
% 分析:在三维MATLAB绘图中,x的个数代表数据点数组的列数,y的个数代表数据点数组的行数,
%      所以z包含61行x81列合计4941个值。
% Get x and y values to calculate
x = -4:0.1:4;
y = -3:0.1:3;
% Pre-allocate the arrays for speed
array1 = zeros(length(y),length(x));
array2 = zeros(length(y),length(x));
array3 = zeros(length(y),length(x));
% Populate the arrays
for jj = 1:length(x)      % 列数
    for ii = 1:length(y)  % 行数
        array1(ii,jj) = x(jj);
        array2(ii,jj) = y(ii);
        array3(ii,jj) = exp(-0.5*(array1(ii,jj)^2+0.5*(array1(ii,jj)-array2(ii,jj))^2));
    end
end
% Plot the data
mesh(array1,array2,array3);
title('\bf Mesh Plot'); xlabel('\bf x'); ylabel('\bf y'); zlabel('\bf z');
2、使用MATLAB函数meshgird来创建x和y值的数组
meshgird函数的一般形式为
[arr1,arr2] = meshgrid(xstart:xinc:xend,ystart:yinc:yend);
其中,xstart:xinc:xend指明了包含在网格中的x值,ystart:yinc:yend指明了包含在网格中的y值。
% 创建如下函数的网格绘图 z(x,y)=e^{
     -0.5*(x^2+0.5(x-y)^2)}
% 其中 -4<=x<=4,-3<=y<=3,取值间隔为0.1。
% Get x and y values to calculate
[array1,array2] = meshgrid(-4:0.1:4,-3:0.1:3);
% Calculate z
array3 = exp(-0.5*(array1.^2+0.5*(array1-array2).^2));
% Plot the data
mesh(array1,array2,array3);
title('\bf Mesh Plot'); xlabel('\bf x'); ylabel('\bf y'); zlabel('\bf z');
使用曲面和网格绘图创建三维物体
曲面和网格绘图可用于创建封闭对象(如球体)的绘图。
% Define the number of angles on the sphere to plot
n = 20;
% Calculate the points on the surface of the sphere
r = 1;                         % 半径
theta = linspace(-pi,pi,n);    % 方位角
phi = linspace(-pi/2,pi/2,n);  % 仰角
[theta,phi] = meshgrid(theta,phi);
% Convert to (x,y,z) values
x = r*cos(phi).*cos(theta);
y = r*cos(phi).*sin(theta);
z = r*sin(phi);
% Plot the sphere
figure;
surf(x,y,z);
alpha(0.5);   % 控制当前轴上物体表面和贴片的透明度
title('\bf Sphere');


