线性代数——二次型
一:通过矩阵研究二次方程
二次型的定义:
把含有n个变量的二次齐次函数或方程称为二次型,例如:
二次型可以用矩阵来表示:
更一般的情况:
在《Linear Algebra and Its Applications》中译本《线性代数及其应用》中,二次型的定义如下:
在向量计算中常遇到的![]() ,求向量元素的平方和,这类平方和及其更一般形式称为二次型。
,求向量元素的平方和,这类平方和及其更一般形式称为二次型。
![]() 上的一个二次型是定义在
上的一个二次型是定义在![]() 上的函数,其在向量x处的值为:
上的函数,其在向量x处的值为:
![]()
其中矩阵A是一个对称矩阵,矩阵A称为关于二次型的矩阵。
二次型是为研究二次函数或二次多项式而生,这样就能理解《线性代数及其应用》中二次型的定义,以及一些二次型的性质。
二:规范化
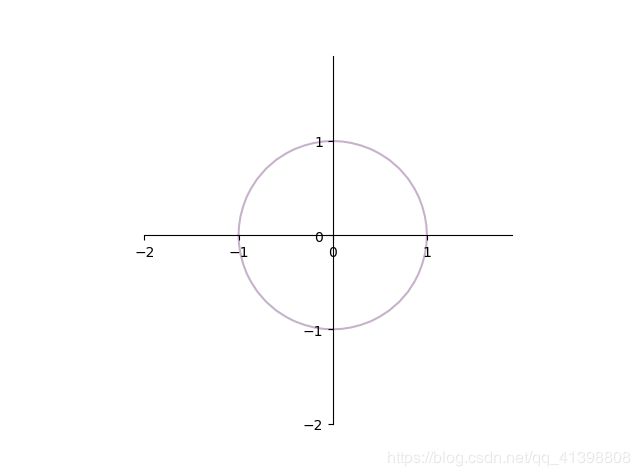
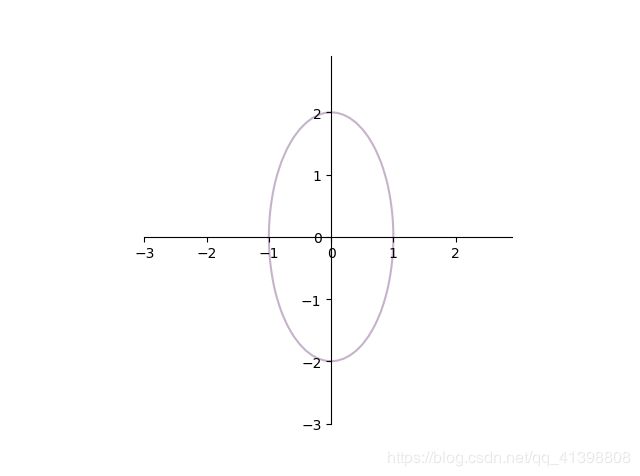
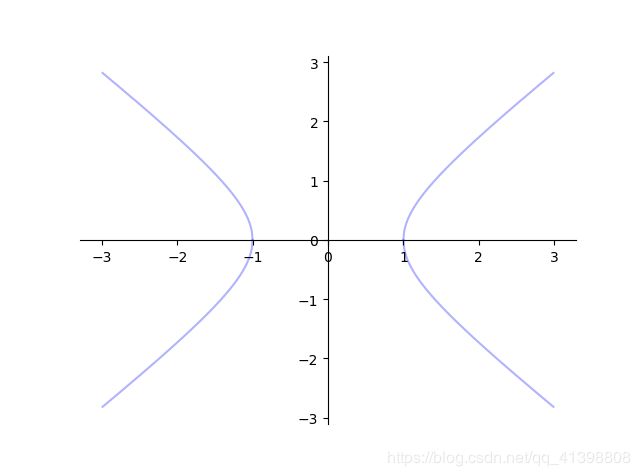
二次型或二次齐次方程有着显著的几何意义,一个二元二次函数是二维空间的一个圆,椭圆或双曲线:
这样一看,圆,椭圆,双曲线是线性关系,通过矩阵变换可以相互转化,准确说是一种仿射,它们都是圆锥体与平面的交线,所以统称为圆锥曲线。
除了通过坐标变化,解析几何的方法外,可以对 其二次型矩阵,进行特征值分解:
a = np.array([[5/8, -3/8], [-3/8, 5/8]])
eval_sigma1,evec_u = np.linalg.eigh(a)
三:正定二次型
对于一个二次型![]() :
:
a.如果对所有的![]() ,有
,有![]() ,则二次型
,则二次型![]() 称为正定的
称为正定的
b.如果对所有的![]() ,有
,有![]() ,则二次型
,则二次型![]() 称为负定的
称为负定的
c.如果![]() 既有正值又有负值,则二次型
既有正值又有负值,则二次型![]() 称为不定的
称为不定的
d.如果对所有的![]() ,
,![]() ,则
,则![]() 称为半正定的,如果对所有的
称为半正定的,如果对所有的![]() ,
,![]() ,则
,则![]() 称为半负定的
称为半负定的
二次型与矩阵A的特征值的关系:
a.当且仅当矩阵A的特征值全为正数,则二次型![]() 为正定的
为正定的
b.当且仅当矩阵A的特征值全为负数,则二次型![]() 为负定的
为负定的
c.当且仅当矩阵A的特征值既有负数又有正数,则二次型![]() 为不定的
为不定的
由于任意的二次型可以通过二次型矩阵的特征值分解(二次型的矩阵都是对称矩阵,对称矩阵都可以进行特征值分解),来扶正:
所以任意的二次型可以转换为上述特征值的表示形式,以方程形式表示为:
![]()
当特征值都为正时,![]() 恒成立
恒成立
当特征值都为负时,![]() 恒成立
恒成立
当特征值有正有负时,![]() 的值,正负都有
的值,正负都有
这样就证明了二次型的矩阵特征值与其二次型的正定关系。
四:文中图片源码
文中的图片使用Python制作,代码如下:
from matplotlib.patches import Ellipse, Circle
import matplotlib.pyplot as plt
import matplotlib
import math
import numpy as np

def picture1():
    fig = plt.figure()
    ellip1 = Ellipse(xy = (0.0, 0.0), width = 2, height = 4, angle = -45, facecolor = 'yellow', alpha = 0.3)
    ellip2 = Ellipse(xy = (0.0, 0.0), width = 2, height = 4, angle = 0, facecolor = 'blue', alpha = 0.3)
    ax = fig.add_subplot(111)
    ax.add_patch(ellip1)
    ax.add_patch(ellip2)

    ax.spines['right'].set_color('none')
    ax.spines['top'].set_color('none')
    ax.spines['bottom'].set_position(('data',0))
    ax.spines['left'].set_position(('data',0))
    ax.xaxis.set_ticks_position('bottom')
    ax.yaxis.set_major_locator(matplotlib.ticker.MultipleLocator(1))

    plt.axis('scaled')
    plt.show()

def Draw_Circle():
    x = y = np.arange(-2, 2, 0.1)
    x, y = np.meshgrid(x, y)
    fig = plt.figure()
    ax = fig.add_subplot(111)
    ax.contour(x, y, x**2 + y**2, [1], alpha = 0.3)

    ax.spines['right'].set_color('none')
    ax.spines['top'].set_color('none')
    ax.spines['bottom'].set_position(('data',0))
    ax.spines['left'].set_position(('data',0))
    ax.xaxis.set_ticks_position('bottom')
    ax.yaxis.set_major_locator(matplotlib.ticker.MultipleLocator(1))
    ax.xaxis.set_major_locator(matplotlib.ticker.MultipleLocator(1))

    plt.axis('scaled')
    plt.show()

def Draw_ellipse():
    a = math.cos(-math.pi/4)
    b = math.sin(-math.pi/4)
    x = y = np.arange(-3, 3, 0.1)
    x, y = np.meshgrid(x, y)
    fig = plt.figure()
    ax = fig.add_subplot(111)
    ax.contour(x*a + y*b, x*b - y*a, x**2 + (1/4)*y**2, [1], alpha = 0.3)
    ax.contour(x, y, x**2 + (1/4)*y**2, [1], alpha = 0.3)
    #ax.contour(x, y, x**2 + y**2, [1], alpha = 0.3)
    #ax.contour(x, y, (5/8)*x**2 - (3/4)*x*y + (5/8)*y**2, [1], alpha = 0.3)

    ax.spines['right'].set_color('none')
    ax.spines['top'].set_color('none')
    ax.spines['bottom'].set_position(('data',0))
    ax.spines['left'].set_position(('data',0))
    ax.xaxis.set_ticks_position('bottom')
    ax.yaxis.set_major_locator(matplotlib.ticker.MultipleLocator(1))
    ax.xaxis.set_major_locator(matplotlib.ticker.MultipleLocator(1))

    plt.axis('scaled')
    plt.show()

def Draw_hyperbola():
    a = [i / 100 for i in range(100, 300, 1)]
    b = [math.sqrt(i**2 - 1) for i in a]
    fig = plt.figure()
    ax = fig.add_subplot(111)
    ax.plot(a, b, color = "blue", alpha = 0.3)
    ax.plot(a, [-i for i in b], color = "blue", alpha = 0.3)
    ax.plot([-i for i in a], b, color = "blue", alpha = 0.3)
    ax.plot([-i for i in a], [-j for j in b], color = "blue", alpha = 0.3)

    ax.spines['right'].set_color('none')
    ax.spines['top'].set_color('none')
    ax.spines['bottom'].set_position(('data',0))
    ax.spines['left'].set_position(('data',0))
    ax.xaxis.set_ticks_position('bottom')
    ax.yaxis.set_major_locator(matplotlib.ticker.MultipleLocator(1))

    plt.show()

if __name__ == "__main__":
    a = np.array([[5/8, -3/8], [-3/8, 5/8]])
    eval_sigma1,evec_u = np.linalg.eigh(a)
    print(eval_sigma1)
    print(evec_u)
    Draw_ellipse()


