数据插值
数据插值
1、一维插值
interp1函数
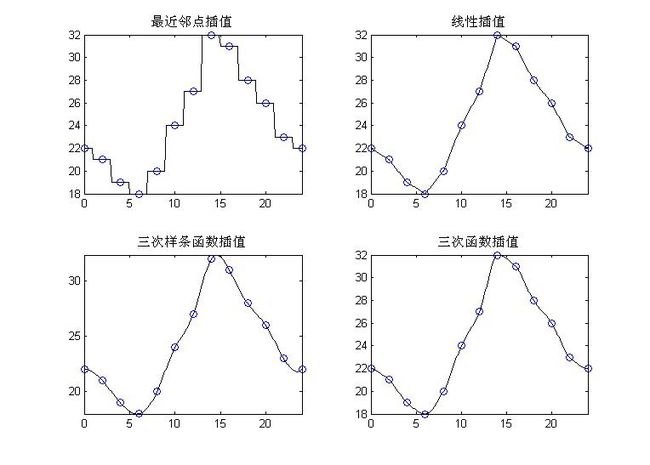
x = 0:2:24;
y = [22,21,19,18,20,24,27,32,31,28,26,23,22];
xi = 0:0.1:24;
subplot(2,2,1);
y1 = interp1(x,y,xi,'nearest');
plot(xi,y1,'k',x,y,'o')
title('最近邻点插值')
axis tight

subplot(2,2,2);
y2 = interp1(x,y,xi,'linear');
plot(xi,y2,'k',x,y,'o')
title('线性插值');
axis tight

subplot(2,2,3);
y3 = interp1(x,y,xi,'spline');
plot(xi,y3,'k',x,y,'o')
title('三次样条函数插值')
axis tight

subplot(2,2,4);
y4 = interp1(x,y,xi,'cubic');
plot(xi,y4,'k',x,y,'o')
title('三次函数插值')
axis tight

x0 = 12.75;
A = interp1(x,y,x0,'nearest')
B = interp1(x,y,x0,'linear')
C = interp1(x,y,x0,'spline')
D = interp1(x,y,x0,'cubic')
A =
27
B =
28.8750
C =
29.0157
D =
29.1313
interpft函数
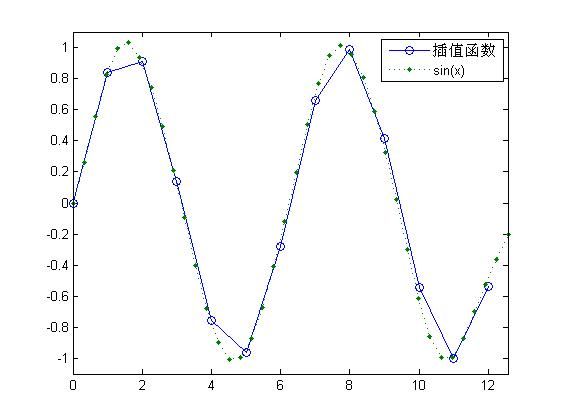
x = 0 : 4*pi;
y = sin(x);
yi = interpft(y,40);
xi = linspace(0,4*pi,40);
plot(x,y,'-o',xi,yi,':.');
legend('插值函数','sin(x)');
axis([0,4*pi,-1.1,1.1]);
二维插值
interp2函数
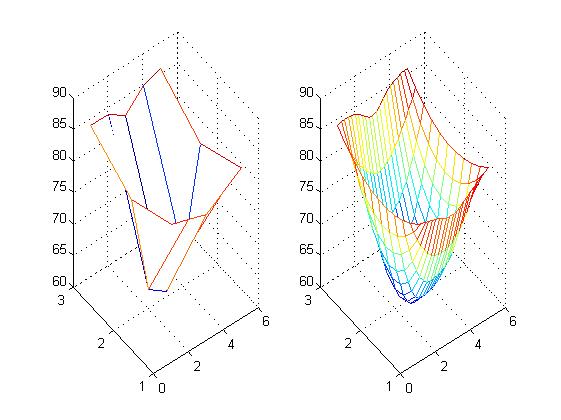
x = 1:5;
y = 1:3;
z = [82 81 80 82 84; 79 63 61 65 81; 84 84 82 85 86];
xi = 1:0.2:5;
subplot(1,2,1);
mesh(x,y,z);
[Xi, Yi] = meshgrid(1:0.2:5,1:0.2:3);
Zi = interp2(x,y,z,Xi,Yi,'cubic');
subplot(1,2,2);
mesh(Xi,Yi,Zi);
griddata函数
x = [129,140,103.5,88,185.5,195,105,157.5,107.5,77,81,162,162,117.5];
y = [7.5,141.5,23,147,22.5,137.5,85.5,-605,-81,3,56.5,-66.5,84,-33.5];
z = -[4 8 6 8 6 8 8 9 9 8 8 9 4 9];
subplot(2,1,1);
[Xi,Yi] = meshgrid(75:0.5:200, -90:0.5:150);
Zi = griddata(x,y,z,Xi,Yi,'cubic');
mesh(Xi,Yi,Zi);
subplot(2,1,2);
v = contour(Xi,Yi,Zi,[-4,-4,-5,-5],'k');
clabel(v)