时序分析(8) -- GARCH(p,q)模型
时序分析(8)
GARCH(p,q)模型
上篇文章我们探讨了ARCH模型对时序数据的波动性进行建模和预测,本篇文章介绍GARCH模型。 首先我们介绍GARCH模型的基本概念:
Generalized Autoregressive Conditionally Heteroskedastic Models - GARCH(p,q)
简单来说,GARCH模型就是ARMA模型应用在时序的方差上,它包含一个自回归项和一个移动平均项.
如果时序数据 { y t } \{y_t\} {yt}可以表示为
y t = σ t w t y_t=\sigma_t w_t yt=σtwt
其中 { w t } \{w_t\} {wt}是高斯白噪声,均值为0,方差为1,这里 σ t \sigma_t σt为
σ t 2 = α 0 + ∑ i = 1 q α i y t − i 2 + ∑ j = 1 p β j σ t − j 2 \sigma_t^2=\alpha_0+\sum_{i=1}^{q}\alpha_iy_{t-i}^2+\sum_{j=1}^{p}\beta_j\sigma_{t-j}^2 σt2=α0+i=1∑qαiyt−i2+j=1∑pβjσt−j2
让我们先从简单做起,考虑GARCH(1,1)模型
y t = σ t w t y_t=\sigma_tw_t yt=σtwt
σ t 2 = α 0 + α 1 y t − 1 2 + β 1 σ t − 1 2 \sigma_t^2=\alpha_0+\alpha_1y_{t-1}^2+\beta_1\sigma_{t-1}^2 σt2=α0+α1yt−12+β1σt−12
注意:这里 α 1 + β 1 < 1 \alpha_1+\beta_1 \lt 1 α1+β1<1,否则时序将会不稳定。
导入python包和数据
如前一样
我们先模拟一个GARCH(1,1)时序
# Simulating a GARCH(1, 1) process
np.random.seed(2)

a0 = 0.2
a1 = 0.5
b1 = 0.3

n = 10000
w = np.random.normal(size=n)
y = np.zeros_like(w)
sigsq = np.zeros_like(w)

for i in range(1, n):
    sigsq[i] = a0 + a1*(y[i-1]**2) + b1*sigsq[i-1]
   y[i] = w[i] * np.sqrt(sigsq[i])
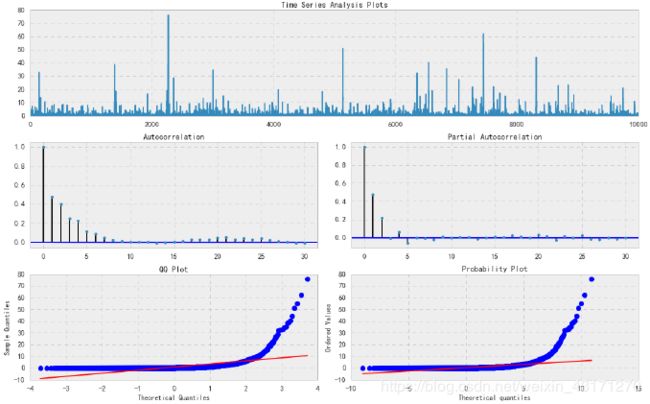
_ = tsplot(y, lags=30)
模拟时序的平方
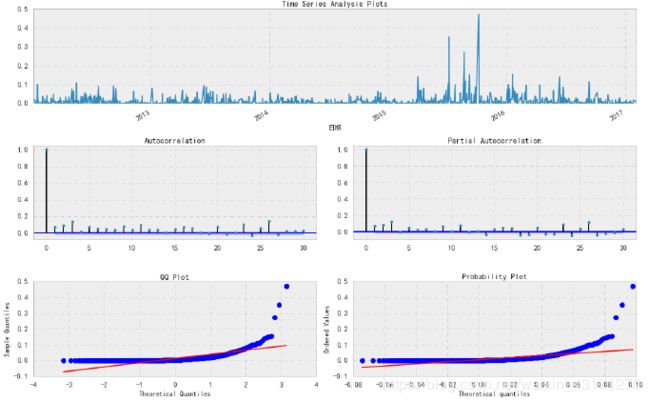
tsplot(y*y, lags=30)

从ACF,PACF中显示出显著自相关性,我们需要AR项和MA项。
我们尝试是否可以通过模型拟合来得到模拟的参数。
# Fit a GARCH(1, 1) model to our simulated EPS series
# We use the arch_model function from the ARCH package
am = arch_model(y)
res = am.fit(update_freq=5)
print(res.summary())
模拟数据GARCH残差plot
_ = tsplot(res.resid, lags=30)
以GARCH建模国内股票收益率
步骤如下:
- 以ARIMA模型迭代得到最佳参数。
- 以ARIMA模型所得到地具备最低AIC的参数来选择GARCH模型。
- 使GARCH模型适配时序数据。
- 检查模型残差和残差平方的自相关性。
def _get_best_model(TS):
    best_aic = np.inf
    best_order = None
    best_mdl = None
    pq_rng = range(5) # [0,1,2,3,4]
    d_rng = range(2) # [0,1]
    for i in pq_rng:
        for d in d_rng:
            for j in pq_rng:
                try:
                    tmp_mdl = smt.ARIMA(TS, order=(i,d,j)).fit(
                                       method='mle', trend='nc'
                              )
                    tmp_aic = tmp_mdl.aic
                    if tmp_aic < best_aic:
                        best_aic = tmp_aic
                        best_order = (i, d, j)
                        best_mdl = tmp_mdl
                 except: continue

    print('aic: {:6.5f} | order: {}'.format(best_aic, best_order))
    return best_aic, best_order, best_mdl
# Notice I've selected a specific time period to run this analysis
TS = indexs_logret['国内股票']
res_tup = _get_best_model(TS)
aic: -6601.86081 | order: (3, 0, 2)
得到p,d,q = 3,0,2
残差Plot
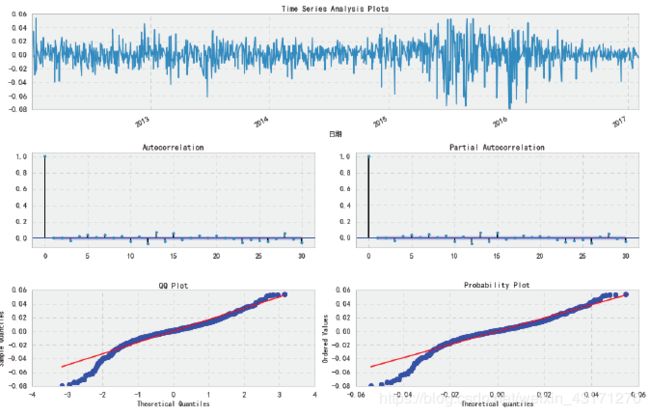
_ = tsplot(res_tup[2].resid, lags=30)
残差平方
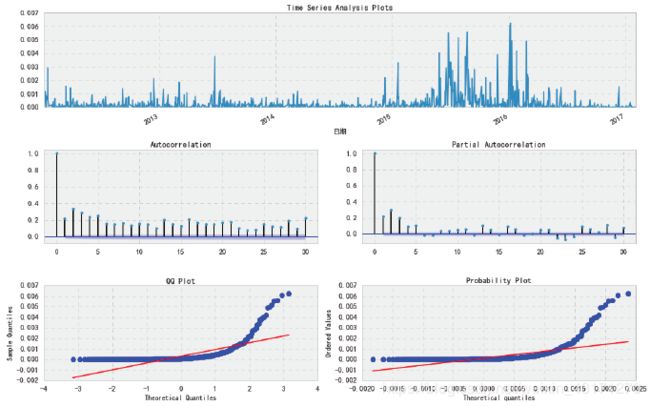
_ = tsplot(res_tup[2].resid**2, lags=30)
拟合GARCH模型
order = [3,0,2]
p_ = order[0]
o_ = order[1]
q_ = order[2]

# Using student T distribution usually provides better fit
am = arch_model(10*TS, p=p_, o=o_, q=q_, dist='StudentsT')
res = am.fit(update_freq=5, disp='off')
print(res.summary())
_ = tsplot(res.resid, lags=30)
香港股票收益率GARCH拟合
过程同上
aic: -1958.01617 | order: (2, 0, 2)
得到p,d,q=2,0,2
残差Plot

残差平方Plot

拟合GARCH模型
order = [2,0,2]
p_ = order[0]
o_ = order[1]
q_ = order[2]
# Using student T distribution usually provides better fit
am = arch_model(10*TS, p=p_, o=o_, q=q_, dist='StudentsT')
res = am.fit(update_freq=5, disp='off')
print(res.summary())
总结
本文展示了采用Python语言为指数时序数据进行GARCH建模,并介绍了GARCH模型的基本概念。


