台湾国立大学郭彦甫Matlab教程笔记(11) advanced 2D plots 上
台湾国立大学郭彦甫Matlab教程笔记(11)
today:
1.advanced 2D plots
2.color space色彩使用
3.3D plots
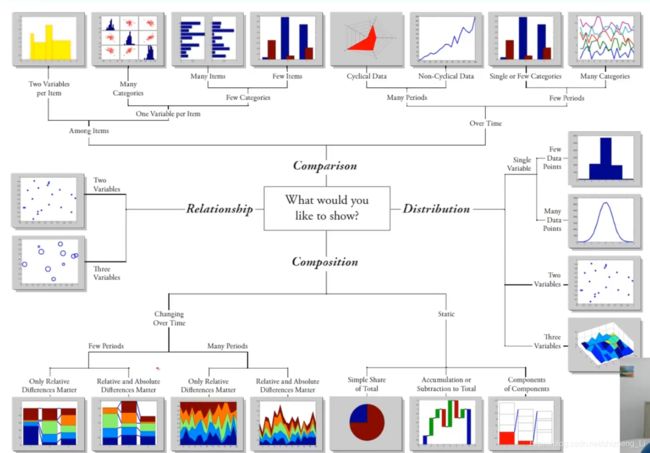
图形概览,做研究的时候需要选择图形
special plots特殊绘图
funtions1:
loglog: graph with logarithmic scales for both axes两个坐标轴都是对数
semilogx:graph with a logarithmic scale for the x-axis and a linear scale for the y-axis 一个坐标x坐标是对数
semilogy:graph with a logarithmic scale for the y-axis and a linear scale for the x-axis一个坐标y坐标是对数
plotyy:gragh with y-tick labels on the left and right side两侧y轴
functions2:
hist: histogram plot直方图
bar: bar graph柱状图
pie:pie chart饼状图
polar :polar coordinate plot极坐标绘图
对数部分:
举例子:
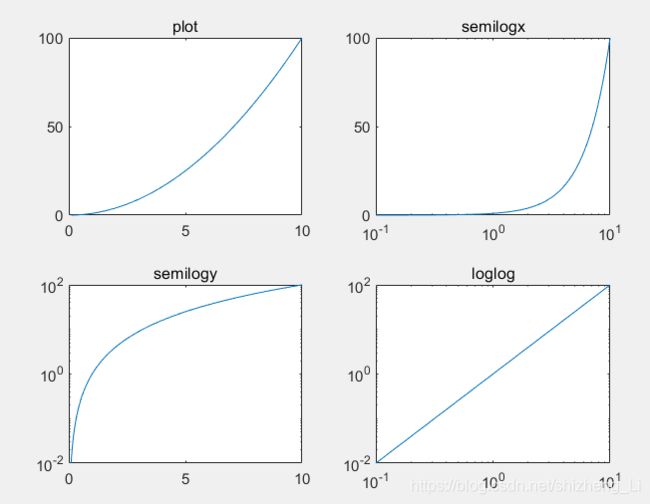
x=logspace(-1,1,100);%x从10的-1次方到10的1次方,其中有100个数
y=x.^2;%y也是100个数
subplot(2,2,1);%第一个图
plot(x,y);
title('plot');
subplot(2,2,2);%第二个图
semilogx(x,y);%x取对数就变成 -1 、0、1
title('semilogx');
subplot(2,2,3);%第三个图
semilogy(x,y);%y轴取对数
title('semilogy');
subplot(2,2,4);%第四个图
loglog(x,y);%两个轴都取对数
title('loglog');
图一:坐标轴正常
图二:x轴取对数,y轴正常linear,x轴变成-1、0、1
图三:y轴取对数,x轴正常,y轴变成-1、0、1
图四:两个轴同时取对数,变成直线
现在加一句代码:
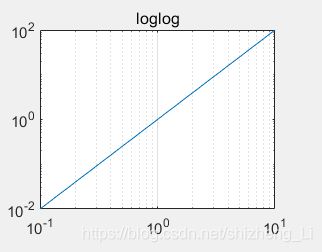
set(gca,'xgrid','on');
看一下效果:会出现网格,可以看出来网格不均匀,可以体会取对数的效果。
下一页:
plotyy()函数
有两个y轴,可以画在同一张图上
看一个例子
这个方程如下

我们想象一下这个方程图形大概长什么样子
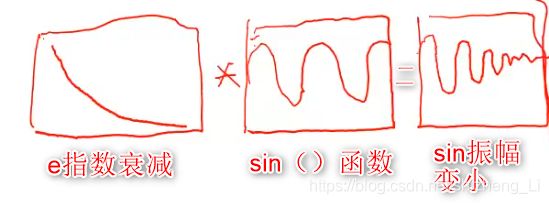
使用plotyy()函数:
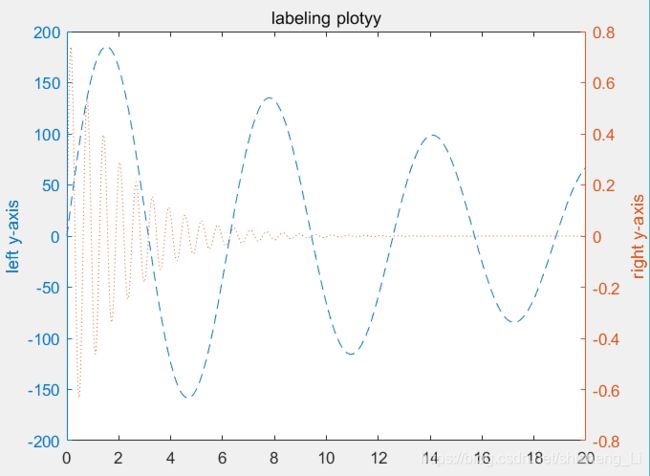
[AX,H1,H2]=plotyy(x,y1,x,y2);
绘制两个函数y1和y2,传出来三个句柄handle:AX是坐标轴X,axis;H1是第一条曲线的handle,H2是第二条曲线的handle
其中,最主要的是AX这个handle,主要靠这个handle来设置两侧的y轴显示
set(get(AX(1),'Ylabel'),'string','Left Y-axis');
set(get(AX(2),'Ylabel'),'string','Right Y-axis');
获取左边的y轴,使用get(AX(1),‘Ylabel’) ,同理,获取右边的轴,使用get(AX(2),‘Ylabel’);
画图总的源代码:
x=0:0.01:20;
y1=200*exp(-0.05*x).*sin(x);
y2=0.8*exp(-0.5*x).*sin(10*x);
[AX,H1,H2]=plotyy(x,y1,x,y2);%获取句柄
set(get(AX(1),'ylabel'),'string','left y-axis');%设置左边y轴,名称是‘left y-axis’
set(get(AX(2),'ylabel'),'string','right y-axis');%设置右边y轴
title('labeling plotyy');
set(H1,'linestyle','--');%设置画线的风格
set(H2,'linestyle',':');
统计的图形
histogram分布图,柱形统计图
功能:看整体分布的情况
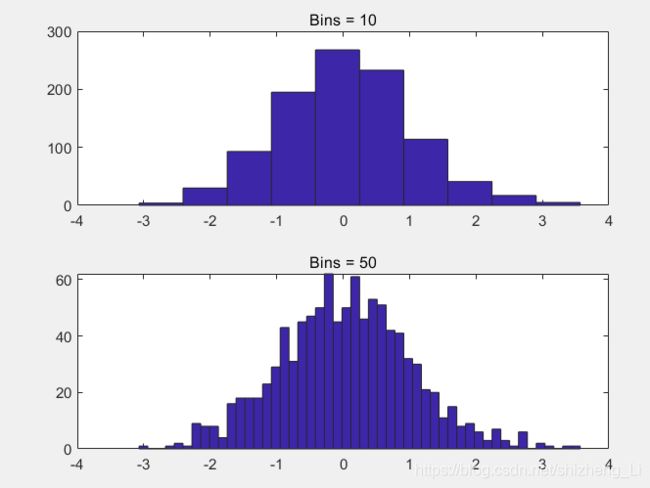
hist(y,10);怎么解释,hist()里面有两个argument参数,第一个y要绘制的变量,第二个参数是 柱形的个数。10表示分布图中有10个柱形长条。
我们来产生一些data来看分布长什么样子
例程:
y=randn(1,1000);
subplot(2,1,1);
hist(y,10);%有10个长矩形
title('Bins = 10');
subplot(2,1,2);
hist(y,50);%有50个长矩形
title('Bins = 50');
我们来看一下 直方图的效果图
Bar charts柱状图
看个别的情况
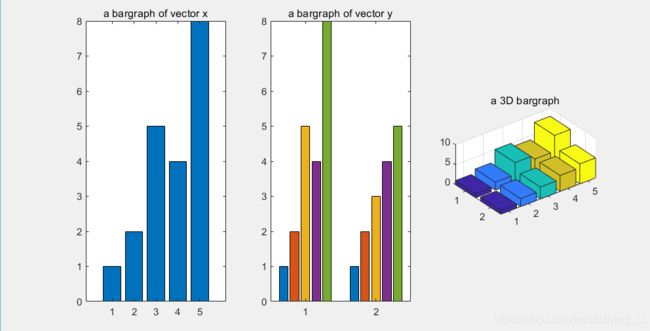
x=[1 2 5 4 8];%每一个长条的高度
y=[x;1:5];%y是一个matrix ,会分成两组bar ,如第二个图
x是一个向量,bar(x)会产生一个bar
y是一个两行的矩阵,bar(y)会产生两个bar
bar3(y),这个是绘制三维的图形
例程:
x=[1 2 5 4 8];%每一个长条的高度
 y=[x;1:5];%y是一个matrix ,会分成两组bar ,如第二个图
subplot(1,3,1); bar(x); title("a bargraph of vector x");
subplot(1,3,2);bar(y); title('a bargraph of vector y');
subplot(1,3,3);bar3(y); title('a 3D bargraph');
下面是
stacked and horizontal bar charts
压栈和水平柱状图
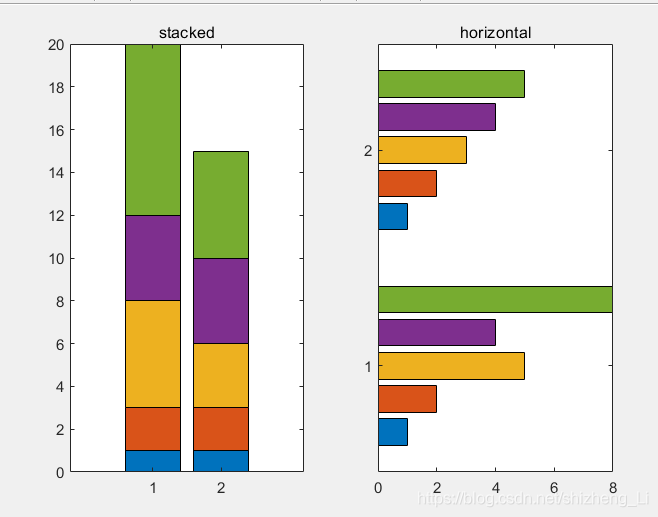
stacked压栈:每一个块的高度表示每一个的大小
指令bar(y,‘stacked’); 后面用单引号里面是stacked ,就是这种格式
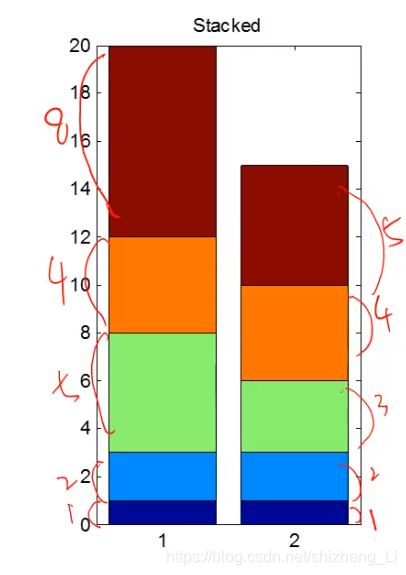
horizontal 给柱状图变成水平的
指令是barh() bar 后面加一个 horizontal 的首字母
例程代码:
x=[1 2 5 4 8];
y=[x;1:5];
subplot(1,2,1);
bar(y,'stacked');%堆栈式的bar
title("stacked");
subplot(1,2,2);
barh(y);%水平式的bar
title('horizontal');
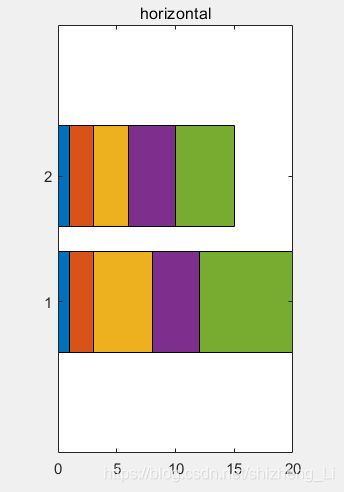
我的练习代码:
barh(y,'stacked');
Pie Charts饼状图
composition chart 组成图,看各个部分的比例
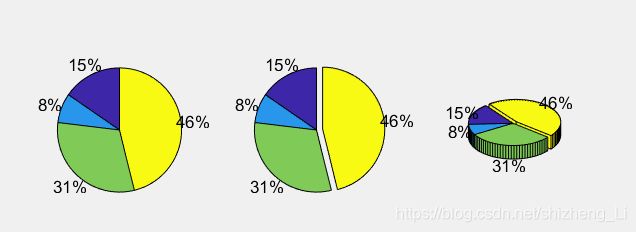
函数用法:pie(a),a是一个向量
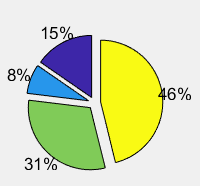
pie(a,[0 0 0 1])第二个参数是一个vector ,如果哪个位置是1,则表示pie chart 图哪个扇形会裂开
pie3(a)三维的饼状图
看例子
a=[10 5 20 30];四个部分的数据给出了,求各个部分占比多少
代码:
a=[10 5 20 30];
subplot(1,3,1);pie(a);
subplot(1,3,2);pie(a,[0,0,0,1]);
subplot(1,3,3);pie3(a,[0,0,0,1]);
pie(a,[1,1,1,1]);
下面是
Polar Chart极坐标图
用角度和半径来画图 (theta 和 r)
polar chart长这个样子
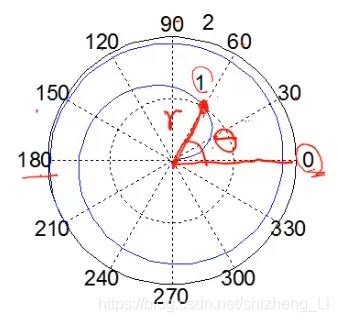
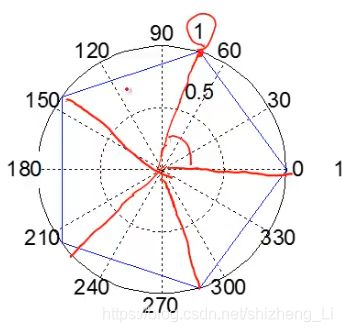
五边形怎么画?我们要找角度theta和半径r
五边形是360°分成了五等分,可以用linspace()函数来帮忙,它可以返回增加的角度,也就是五等分的角度。 linspace(0,2pi,6);这里写6的原因是 6个数,中间间隔是5个。所以角度 theta=linspace(0,2pi,6); 半径r取1,r=ones(1,length(theta));
我们现在要绘制如下四张图:

例程代码:
x=1:100;theta =x/10; r=log10(x);
subplot(1,4,1);polar(theta,r);
theta=linspace(0,2*pi);r=cos(4*theta);
subplot(1,4,2);polar(theta,r);
theta=linspace(0,2*pi,6);r=ones(1,length(theta));
subplot(1,4,3);polar(theta,r);
theta=linspace(0,2*pi); r=1-sin(theta);
subplot(1,4,4);polar(theta,r);
笔者计算机跑出来的效果:
作业题:

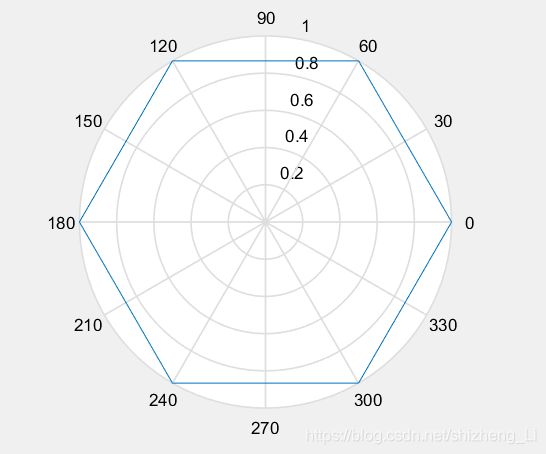
题目:绘制六边形
我的练习:
思路:找到theta 和r 。六边形 被分成六个部分,同样可以用linspace()函数
代码:
theta=linspace(0,2*pi,7);
r=ones(1,length(theta));
polar(theta,r);
stairs and stem charts阶梯图和火柴梗图
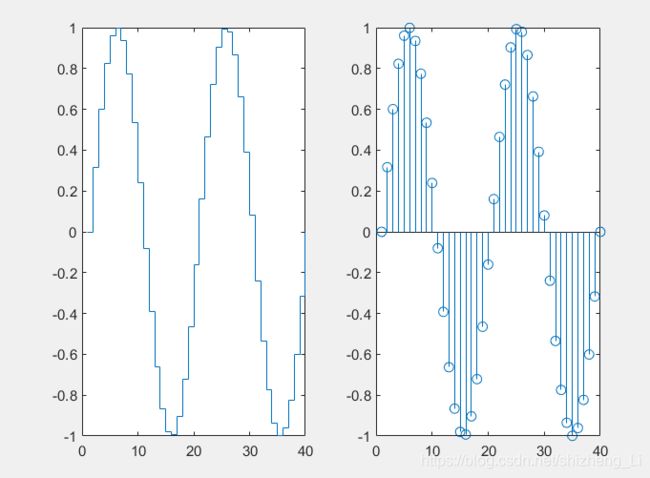
stairs画图是画阶梯状的图
stem画图是竖线图
下面这个程式是绘制sin()函数,使用stairs()函数和stem()函数
例程:
x=linspace(0,4*pi,40); y=sin(x);
subplot(1,2,1); stairs(y);
subplot(1,2,2); stem(y);
现在再来注记一下 linspace 不是 line space 的缩写,是linearly space 线性空间的缩写,这样就不会记错,写错了。linspace是线性空间的生成
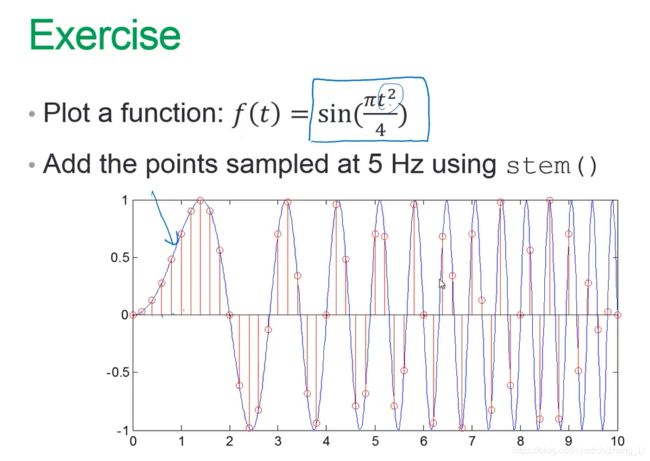
题目:绘制函数f(t),然后取样
我的练习:
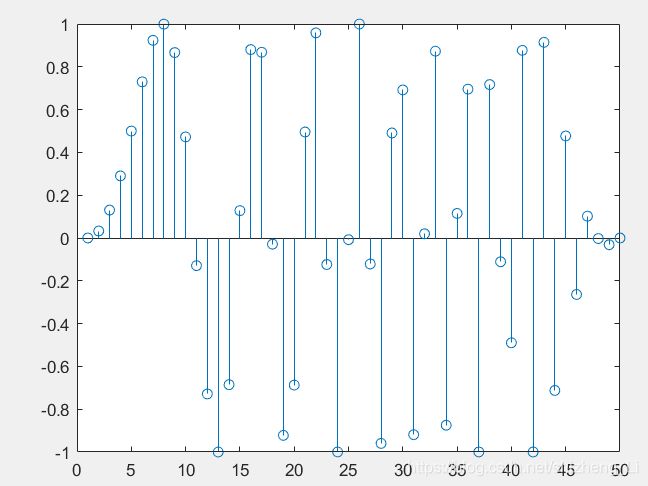
分析:要求5HZ取样,根据时间和频率的关系,5hz对应的是0.2s,然后根据上图要求,时间从0到10秒,所以需要10/0.2=50个采样
我的代码:
t=linspace(0,10,50);
f=sin(pi/4*t.*t);
stem(f);
运行结果:
Boxplot and Error Bar
在统计中常用
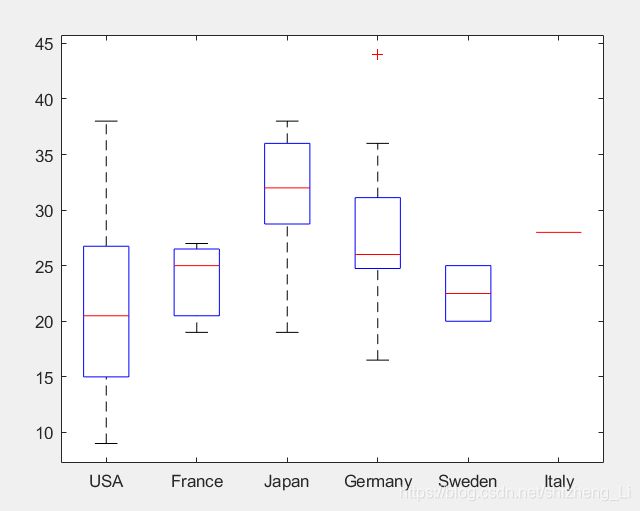
boxplot(x) creates a box plot of the data in x. If x is a vector, boxplot plots one box. If x is a matrix, boxplot plots one box for each column of x.
执行一个例程
load carsmall
boxplot(MPG,Origin);
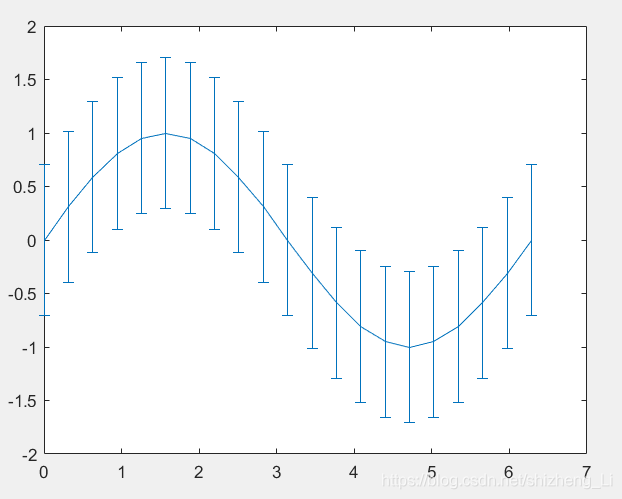
error bar 描绘出误差
做研究的时候可能需要指出数据的误差范围
e=std(y)*ones(size(x));这里用的是标准差来算的长度
执行一个例程:
x=0:pi/10:2*pi;
y=sin(x);
e=std(y)*ones(size(x));
errorbar(x,y,e);%e指的是画出线的长度
【总结】
本文记录了advanced 2D plots一部分
funtions1:
loglog: graph with logarithmic scales for both axes两个坐标轴都是对数
semilogx:graph with a logarithmic scale for the x-axis and a linear scale for the y-axis 一个坐标x坐标是对数
semilogy:graph with a logarithmic scale for the y-axis and a linear scale for the x-axis一个坐标y坐标是对数
plotyy:gragh with y-tick labels on the left and right side两侧y轴
functions2:
hist: histogram plot直方图
bar: bar graph柱状图
pie:pie chart饼状图
polar :polar coordinate plot极坐标绘图
functions3:
stairs(),stem(),boxplot(),errorbar()
以上是关于统计的一部分图形学习与练习
