梯度向量与梯度下降法
最近非常热门的“深度学习”领域,用到了一种名为“梯度下降法”的算法。梯度下降法是机器学习中常用的一种方法,它主要用于快速找到“最小误差”(the minimum error)。要掌握“梯度下降法”,就需要先搞清楚什么是“梯度”,本文将从这些基本概念:方向导数(directional derivative)与偏导数、梯度(gradient)、梯度向量(gradient vector)等出发,带您领略“深度学习”中的“最小二乘法”、“梯度下降法”和“线性回归”。
- 偏导数(Partial derivate)
- 方向导数(Directional derivate)
- 梯度(Gradient)
- 线性回归(linear regression)
- 梯度下降(Gradient descent)
一、方向导数
1,偏导数
先回顾一下一元导数和偏导数,一元导数表征的是:一元函数 f(x) f ( x ) 与自变量 x x 在某点附近变化的比率(变化率),如下:
而二元函数的偏导数表征的是:函数 F(x,y) F ( x , y ) 与自变量 x x (或 y y ) 在某点附近变化的比率(变化率),如下:
以长方形的面积 z=F(x,y) z = F ( x , y ) 为例,如下图:
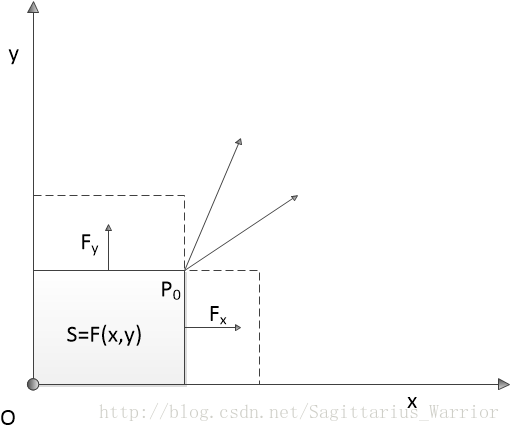
如果说 z=F(x,y)=x⋅y z = F ( x , y ) = x ⋅ y 表示以 P(x,y) 点和原点为对角点的矩形的面积,那么 z=F(x,y) z = F ( x , y ) 在 P0 P 0 点对x 的偏导数表示 P0 P 0 点沿平行于 x 轴正向移动,矩形的面积变化量与 P0 P 0 点在 x方向的移动距离的比值
同样地,可得
需要注意的是:
矩形面积的这个例子有时候也很容易让人混淆,上图中无论 x 还是 y ,都是输入变量,输出变量 S 并没有用坐标轴的形式画出来。也就是说,这个例子实际上是一个三维空间的函数关系,而不是二维平面的函数关系。
向量角度看偏导数:
偏导数向量 [FxFy] [ F x F y ] 是坐标向量(原向量) [xy] [ x y ] 的线性变换,详见《Essence of linear algebra》:求导是一种线性变换。
扩展一下:如果 P0 P 0 点不是沿平行于 x 轴方向或平行于 y 轴方向,而是 沿与 x 轴成夹角 α α 的一条直线 l l 上移动,那么面积的增量与 P0 P 0 点在该直线上移动的距离的比值关系是什么呢?
假设 P0 P 0 点在这条直线上移动的距离为 Δt Δ t ,则有
那么,矩形面积增量与移动距离的增量比值是:
与偏导数类似,上式也是一个“一元导数”。事实上,这就是方向导数,可记作
2,矢量描述
从矢量角度来看, P0 P 0 点沿与 x 轴成夹角 α α 的一条直线 l l 移动,这个移动方向可以看作是一个矢量 —— “方向矢量”
如果 α=0 α = 0 ,即沿平行 x 轴方向移动;如果 α=π2 α = π 2 ,即沿平行 y 轴方向移动。因此,偏导数实际上是方向导数的一种特例。
在回顾一下上一节“二元全微分的几何意义”:用切平面近似空间曲面。这个切平面实际上是由两条相交直线确定的平面,而这两条直线分别是 x 方向的偏导数向量 Px→ P x → 和 y 方向的偏导数向量 Py→ P y → 。很显然,这两个向量不但位于同一个平面,而且相互垂直。那么这两个向量合成的新向量也一定位于这个“切平面”。
注:关于偏导数向量相互垂直,可以很容易从偏导数“切片法”推导出来。
将偏导数合成向量记作 P⃗ =(Fx,Fy)=(∂F∂x,∂F∂y) P → = ( F x , F y ) = ( ∂ F ∂ x , ∂ F ∂ y ) 。如果对偏导数向量和方向向量进行矢量“内积”,则有:
这个内积在数值上刚好等于 l⃗ l → 方向的方向导数。
换句话说:方向导数就是偏导数合成向量与方向向量的内积。
从向量角度看:
内积在几何上表示投影,也就是说,方向导数(向量)是原向量在某个方向上的投影的变化率。
3,多元方向导数
从上面的矢量内积出发,将 l⃗ l → 与 y 轴方向的夹角表示为 β β ,则方向导数的公式可以变化为:
类似地,推广到多维空间
当然,从向量内积的角度更容易得到这个公式
二、梯度
1,梯度(gradient)
还是从上面的矩形面积这个例子出发,来探索什么是“梯度”。
假设 P0 P 0 点的坐标是 (3–√,1) ( 3 , 1 ) , 则
很明显,方向导数(标量)的大小随 矢量 l⃗ l → 的方向不同而不同。那么,这些方向导数中是否存在一个最大值呢?
答案是肯定的!这就是“梯度”(标量)。
所以,梯度的第一层含义就是“方向导数的最大值”。
2,梯度矢量
梯度的第一层含义是“方向导数的最大值”,那么这个最大值是多少呢?或者说 矢量 l⃗ l → 取什么值时才能找到这个最大值?
还是以矩形面积为例
显然, α=π3 α = π 3 时,取值最大,此时
在比较一下偏导数向量
是不是似曾相识?对的,后者单位化后就变成了前者。
从向量内积的角度来看,更容易理解:
很明显, 两个向量的夹角 θ=0 θ = 0 时,取得最大值。
至此,我们引出了梯度的第二层含义,或者说叫“梯度矢量”
注意:
上面提到的夹角 θ θ 在几何上表示原向量(坐标向量)与导数向量(变化率向量)之间的夹角,所以,梯度的几何含义就是:沿向量所在直线的方向变化率最大。
顺便扩展一下散度(divergence)和旋度(curl)的记号,它们都使用了Nabla算子(微分向量算子),分别如下:
3,举例
总结一下这一节的思路: 偏导数向量合成 → → 合成向量与方向向量内积 → → 方向导数 → → 方向导数的最值 → → 梯度 → → 梯度向量与偏导数合成向量相同
转了一圈,又回来了。
从偏导数合成向量到梯度矢量,让我想起了高中物理中的“力的合成与分解”和“沿合力方向做功最有效率”这些物理知识,恰好能与这些数学概念对应上。
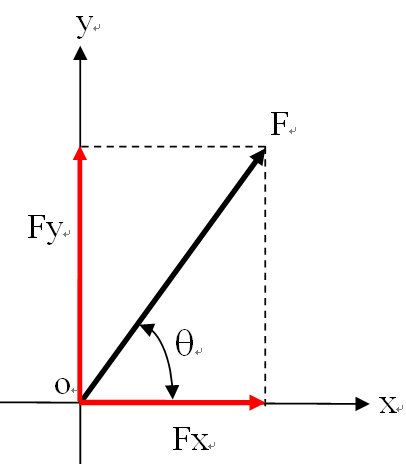
如上图,合力表示偏导数合成向量,“垂直分力”表示x方向和y方向的偏导数向量,那么方向向量则对应“做功”路径,而“沿合力方向做功”则表示方向向量与偏导数合成向量重合。Perfect !
注:在重力场或电场中,做功的结果是改变势能,因此,“做功最有效率”又可以表述为“势能变化率最快”。
注:关于梯度(gradient)可以参考以下文章:
https://math.oregonstate.edu/home/programs/undergrad/CalculusQuestStudyGuides/vcalc/grad/grad.html
https://betterexplained.com/articles/vector-calculus-understanding-the-gradient/
三、梯度下降法
1,梯度下降法
梯度下降法(gradient descent)是一个一阶最优化算法,它的核心思想是:要想最快找到一个函数的局部极小值,必须沿函数当前点对应“梯度”(或者近似梯度)的反方向(下降)进行规定步长“迭代”搜索。如下图:
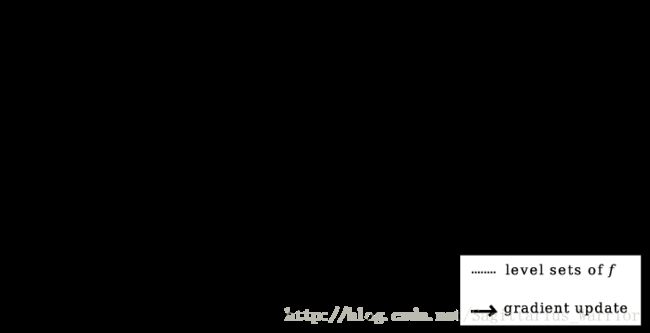
看到上面这幅图,你能想到什么?
我想到了两个概念:一是地理学中的“梯田”和“等高线”,下面的链接中,有一篇文章的作者将“梯度下降”形象的比作“从山顶找路下到山谷”,这么看来,等高线肯定与梯度下降有某种关联。
第二个想到的是电学中的“带电物体的等势面”或者说是“电场等势线”。看一下wiki - potential gradient,可以扩展一下“势能梯度”的知识。
很明显,梯度常常和势能联系在一起,那么势能是什么呢?它就是上图中的弧线圈。这个解释有点虚,给个更贴切的:我们可以把势能看作是 z=f(x,y) z = f ( x , y ) 中的这个 z z ,即函数值。这些弧线圈就表示在它上面的点 (x,y) ( x , y ) 对应的 z=f(x,y) z = f ( x , y ) 的值相等。从空间几何的角度来看这些“弧线圈”,更容易理解: z=f(x,y) z = f ( x , y ) 表示空间曲面,用 z=c z = c 这样一个平面去截空间曲面,它们的交线就是“弧线圈”,公式表示为
当然啦,上图是把多个弧线圈画到(投影)了一个平面上。
我们也可以这样来理解“梯度下降法”: 导数表征的是“函数值随自变量的变化率” → → 梯度是各方向导数中的最大值 → → 沿 “梯度矢量”移动必定变化最快 → → 沿“梯度矢量” 反方向下降(减少)最快。
google MLCC - Gradient descent
2,梯度下降法求极值
求下列函数的极小值
# From calculation, it is expected that the local minimum occurs at x=9/4

cur_x = 6 # The algorithm starts at x=6
gamma = 0.01 # step size multiplier
precision = 0.00001
previous_step_size = cur_x

def df(x):
    return 4 * x**3 - 9 * x**2

while previous_step_size > precision:
    prev_x = cur_x
    cur_x += -gamma * df(prev_x)
    previous_step_size = abs(cur_x - prev_x)

print("The local minimum occurs at %f" % cur_x)
The local minimum occurs at 2.249965
注:关于“gradient descent”还可以参考以下资料:
https://www.analyticsvidhya.com/blog/2017/03/introduction-to-gradient-descent-algorithm-along-its-variants/
http://ruder.io/optimizing-gradient-descent/
3,梯度下降法与最小二乘法
“机器学习”中有六个经典算法,其中就包括“最小二乘法”和“梯度下降法”,前者用于“搜索最小误差”,后者用于“用最快的速度搜索”,二者常常配合使用。代码演示如下:
# y = mx + b
# m is slope, b is y-intercept
def compute_error_for_line_given_points(b, m, coordinates):
    totalerror = 0
    for i in range(0, len(coordinates)):
        x = coordinates[i][0]
        y = coordinates[i][1]
        totalerror += (y - (m * x + b)) ** 2
    return totalerror / float(len(coordinates))

# example
compute_error_for_line_given_points(1, 2, [[3, 6], [6, 9], [12, 18]])
22.0
以上就是用“最小二乘法”来计算误差,当输入为 (1,2) ( 1 , 2 ) 时,输出为 22.0 22.0
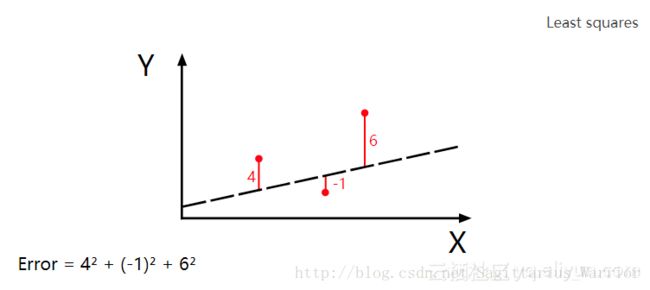
很显然,最小二乘法需要不停地调整(试验)输入来找到一个最小误差。而应用“梯度下降法”,可以加快这个“试验”的过程。
以上面这段程序为例,误差是斜率 m 和常数 b 的二元函数,可以表示为
那么,对最小二乘法的参数调优就转变为了求这个二元函数的极值问题,也就是说可以应用“梯度下降法”了。
“梯度下降法”可以用于搜索函数的局部极值,如下,求下列函数的局部极小值
分析:这是一个一元连续函数,且可导,其导函数是:
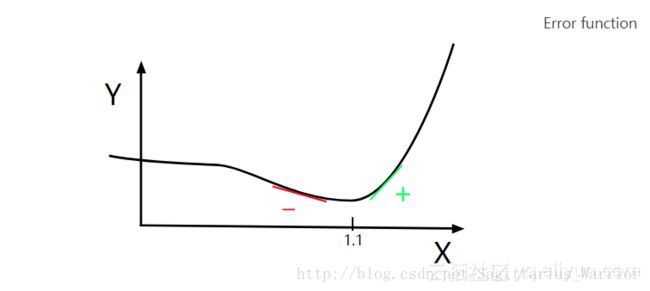
根据“一阶导数极值判别法”:若函数f(x)可导,且f’(x)在 x0 x 0 的两侧异号,则 x0 x 0 是f(x)的极值点。那么,怎么找到这个 x0 x 0 呢?
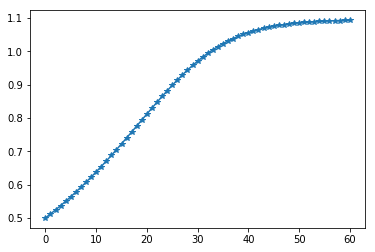
很简单,只需要沿斜率(导数值)的反方向逐步移动即可,如下图:导数为负时,沿x轴正向移动;导数为正时,沿x轴负方向移动。
current_x = 0.5 # the algorithm starts at x=0.5
learning_rate = 0.01 # step size multiplier
num_iterations = 60 # the number of times to train the function

# the derivative of the error function (x ** 4 = the power of 4 or x^4)
def slope_at_given_x_value(x):
    return 5 * x ** 4 - 6 * x ** 2

# Move X to the right or left depending on the slope of the error function
x = [current_x]
for i in range(num_iterations):
    previous_x = current_x
    current_x += -learning_rate * slope_at_given_x_value(previous_x)
    x.append(current_x)   #print(previous_x)

print("The local minimum occurs at %f, it is %f" % (current_x, current_x ** 5 - 2 * current_x ** 3 - 2))
The local minimum occurs at 1.092837, it is -3.051583
import numpy as np
import matplotlib.pyplot as plt
plt.plot(x, marker='*')
plt.show()
沿梯度(斜率)的反方向移动,这就是“梯度下降法”。如上图所示,不管初始化值设为什么,在迭代过程只会越来越接近目标值,而不会偏离目标值,这就是梯度下降法的魅力。
上面这张图是表示的是一个一元函数搜索极值的问题,未必能很好展示梯度下降法的魅力,你再返回去看上面那张“势能梯度图”,那是一个二元函数搜索极值的过程。左边的搜索路径很简洁,而右边的搜索路径,尽管因为初始值的设定,导致它的路径很曲折,但是,你有没有发现,它的每一次迭代事实上离目标都更近一步。我想,这就是梯度下降法的优点吧!
注:这段代码是一元函数求极值,如果是二元函数,则需要同时满足两个分量的偏导数的值为零,下面的线性回归程序算的就是二元偏导数。
通过组合最小二乘法和梯度下降法,你可以得到线性回归,如下:
# Price of wheat/kg and the average price of bread
wheat_and_bread = [[0.5,5],[0.6,5.5],[0.8,6],[1.1,6.8],[1.4,7]]

def step_gradient(b_current, m_current, points, learningRate):
    b_gradient = 0
    m_gradient = 0
    N = float(len(points))
    for i in range(0, len(points)):
        x = points[i][0]
        y = points[i][1]
        b_gradient += -(2/N) * (y -((m_current * x) + b_current))
        m_gradient += -(2/N) * x * (y -((m_current * x) + b_current))
    new_b = b_current -(learningRate * b_gradient)
    new_m = m_current -(learningRate * m_gradient)
    return [new_b, new_m]

def gradient_descent_runner(points, starting_b, starting_m, learning_rate, num_iterations):
    b = starting_b
    m = starting_m
    for i in range(num_iterations):
        b, m = step_gradient(b, m, points, learning_rate)
    return [b, m]

gradient_descent_runner(wheat_and_bread, 1, 1, 0.01, 1000)
[3.853945094921183, 2.4895803107016445]
上面这个程序的核心思想就是:在内层迭代的过程中,算出每一步误差函数相当于 m 和 b 的偏导数(梯度),然后沿梯度的反方向调整 m 和 b ;外层迭代执行梯度下降法,逐步逼近偏导数等于0的点。
其中需要注意偏导数的近似计算公式,已知误差函数
即各点与拟合直线的距离的平方和,再做算术平均。然后可以计算偏导数为
其中的求和公式在程序中表现为内层for循环
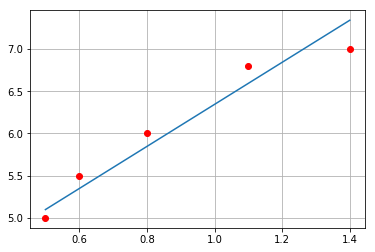
下面再给出拟合后的效果图
import numpy as np
import matplotlib.pyplot as plt
a = np.array(wheat_and_bread)
plt.plot(a[:,0], a[:,1], 'ro')
b,m = gradient_descent_runner(wheat_and_bread, 1, 1, 0.01, 1000)
x = np.linspace(a[0,0], a[-1,0])
y = m * x + b
plt.plot(x, y)
plt.grid()
plt.show()
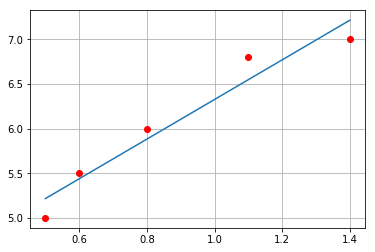
对比Numpy
import numpy as np
import matplotlib.pyplot as plt
a = np.array(wheat_and_bread)
plt.plot(a[:,0], a[:,1], 'ro')
m, b = np.polyfit(a[:,0], a[:,1], 1)
print([b,m])
x = np.linspace(a[0,0], a[-1,0])
y = m * x + b
plt.plot(x, y)
plt.grid()
plt.show()
[4.1072992700729891, 2.2189781021897814]
