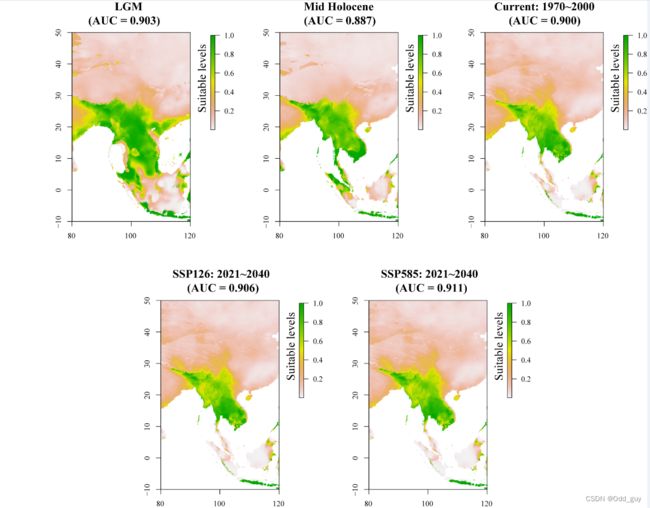
使用Maxent模型预测适生区
Maxent模型因其在潜在适生区预测中稳健的表现,时下已经成为使用最广泛的物种分布模型。biomod虽然可以通过集成模型的优势来弥补数据量较小的劣势,但是其在使用和运算时间上的优势远不如Maxent,虽然最新的biomod2已经修复了一些bug,不过在使用中仍是会遇到很多问题。
1 Maxent模型
Maxent模型即最大熵模型,与热力学概念类似,”熵“在此的含义为随机变量不确定性的度量,最大熵模型是指在学习模型时,熵最大的模型,即在满足所有模型约束条件下,模型的熵最大。对一个随机事件的概率分布进行预测时,预测应当满足全部已知的约束,而对未知的情况不要做任何主观假设。在这种情况下,概率分布最均匀,预测的风险最小,因此得到的概率分布的熵是最大。
所需数据集:
物种分布数据:occ_final
气候因子图层:clim_layer
2 示例
2.1 数据准备
# 1.
# 设立研究区范围:80~120, -10~50
studyArea <- crop(clim_layer,c(80, 120, -10, 50))

dir.create("studyarea", showWarnings = TRUE, recursive = FALSE,mode = "0777")
writeRaster(studyArea,
            ## 文件命名
            filename=paste0("./studyarea/",names(studyArea),".asc"),
            format="ascii", ## 输出编码格式
            bylayer=TRUE, ## 保存图层
            overwrite=T) ##覆盖已有文件

# 2.
# 生成背景点
bg <- sampleRandom(x=studyArea,
                   size=10000,
                   na.rm=T, #removes the 'Not Applicable' points
                   sp=T) # return spatial points

plot(studyArea[[1]])             #研究区图层
plot(bg,add=T)                   #背景点,默认黑色
plot(occ_finnal,add=T,col="red") #物种分布点

# 3.
# 拆分数据集
#设置seed
set.seed(1)

#随机生成数据索引
selected <- sample(1:nrow(occ_finnal), nrow(occ_finnal) * 0.5)

#训练集
occ_train <- occ_finnal[selected, ]

#评估集
occ_test <- occ_finnal[-selected, ]

head(occ_train)
head(occ_test)

#提取经纬度向量
occ_train = occ_train[2:3]
occ_test = occ_test[2:3]

#查看
head(occ_train)
head(occ_test)

#提取训练集的bio数据
p_train <- extract(clim_layer, occ_train)

#提取评估集的bio数据
p_test <- extract(clim_layer, occ_test)

#提取背景点的bio数据
a <- extract(clim_layer, bg)

#查看
head(p_train)
head(a)
head(p_test)

# 4.
# 数据集整合
pa <- c(rep(1, nrow(p_train)), rep(0, nrow(a)))

pder <- as.data.frame(rbind(p_train, a))
2.2 建模
# 5.
# 模型模拟
#加载包
library(dismo)

#创建输出保存目录
dir.create("output",
           showWarnings = TRUE,
           recursive = FALSE,
           mode = "0777")

setwd("./output/")

dir.create("maxent_outputs",
           showWarnings = TRUE,
           recursive = FALSE,
           mode = "0777")

#建模
mod <- maxent(x=pder, ## env conditions
              p=pa,   ## 1:presence or 0:absence
              path=paste0("maxent_outputs"), ## folder for maxent output;
              # if we do not specify a folder R will put the results in a temp file,
              # and it gets messy to read those. . .
              args=c("responsecurves") ## parameter specification
              )

#查看模型结果信息
mod@results
2.3 情景模拟
#------------------------------------------------------------------------------------------------------#
#                                         step 2 预测当前1970~2000                                     #
#------------------------------------------------------------------------------------------------------#
setwd("E:/Class_YNU/Biogeography/Finalpaper/Maxent/use_data/his/final_his/")
curr_list <- dir("./", full.names=T, pattern='.tif')
curr_layer <-  stack(curr_list)

studycurr <- crop(curr_layer,c(80, 120, -10, 50))

writeRaster(studycurr,
            ## 文件命名
            filename=paste0("./",names(studycurr),".asc"),
            format="ascii", ## 输出编码格式
            bylayer=TRUE, ## 保存图层
            overwrite=T) ##覆盖已有文件

#将模型投射到研究区
ped_current <- predict(mod, studycurr)
plot(ped_current,main = "Current: 1970~2000")

#模型评估
e_curr <- evaluate(mod, p=occ_test, a=bg, x=curr_layer)
e_curr
thd_curr <- threshold(e_curr, "no_omission")


#------------------------------------------------------------------------------------------------------#
#                                           step 3 预测过去LGM                                         #
#------------------------------------------------------------------------------------------------------#
setwd("E:/Class_YNU/Biogeography/Finalpaper/Maxent/use_data/LGM/")
lgm_list <- dir("./", full.names=T, pattern='.tif')
lgm_layer <-  stack(lgm_list)

studyLGM <- crop(lgm_layer,c(80, 120, -10, 50))

writeRaster(studyLGM,
            ## 文件命名
            filename=paste0("./",names(studyLGM),".asc"),
            format="ascii", ## 输出编码格式
            bylayer=TRUE, ## 保存图层
            overwrite=T) ##覆盖已有文件

#将模型投射到研究区
ped_LGM <- predict(mod, studyLGM)
plot(ped_LGM,main = "LGM")

#模型评估
e_lgm <- evaluate(mod, p=occ_test, a=bg, x=lgm_layer)

#适生区增减
thd_lgm <- threshold(e_lgm, "no_omission")
plot(ped_LGM >= thd_curr)

#------------------------------------------------------------------------------------------------------#
#                                           step 4 预测过去MH                                         #
#------------------------------------------------------------------------------------------------------#
setwd("E:/Class_YNU/Biogeography/Finalpaper/Maxent/use_data/MH/")
mh_list <- dir("./", full.names=T, pattern='.tif')
mh_layer <-  stack(mh_list)

studyMH <- crop(mh_layer,c(80, 120, -10, 50))

writeRaster(studyMH,
            ## 文件命名
            filename=paste0("./",names(studyMH),".asc"),
            format="ascii", ## 输出编码格式
            bylayer=TRUE, ## 保存图层
            overwrite=T) ##覆盖已有文件

#将模型投射到研究区
ped_MH <- predict(mod, studyMH)
plot(ped_MH,main = "Mid Holocene")
e_MH <- evaluate(mod, p=occ_test, a=bg, x=mh_layer)
thd_mh <- threshold(e_MH, "no_omission")

#------------------------------------------------------------------------------------------------------#
#                                        step 5 预测将来SSP126                                         #
#------------------------------------------------------------------------------------------------------#
setwd("E:/Class_YNU/Biogeography/Finalpaper/Maxent/use_data/SSP126/21_40/")
ssp126_list <- dir("./", full.names=T, pattern='.tif')
ssp126_layer <-  stack(ssp126_list)

study126 <- crop(ssp126_layer,c(80, 120, -10, 50))

writeRaster(study126,
            ## 文件命名
            filename=paste0("./",names(study126),".asc"),
            format="ascii", ## 输出编码格式
            bylayer=TRUE, ## 保存图层
            overwrite=T) ##覆盖已有文件

#将模型投射到研究区
ped_126 <- predict(mod, study126)
plot(ped_126,main = "SSP126: 2021~2040")
e_126 <- evaluate(mod, p=occ_test, a=bg, x=ssp126_layer)
thd_126 <- threshold(e_126, "no_omission")

#------------------------------------------------------------------------------------------------------#
#                                        step 6 预测将来SSP585                                         #
#------------------------------------------------------------------------------------------------------#
setwd("E:/Class_YNU/Biogeography/Finalpaper/Maxent/use_data/SSP585/21_40/")
ssp585_list <- dir("./", full.names=T, pattern='.tif')
ssp585_layer <-  stack(ssp585_list)

study585 <- crop(ssp585_layer,c(80, 120, -10, 50))

writeRaster(study585,
            ## 文件命名
            filename=paste0("./",names(study585),".asc"),
            format="ascii", ## 输出编码格式
            bylayer=TRUE, ## 保存图层
            overwrite=T) ##覆盖已有文件

#将模型投射到研究区
ped_585 <- predict(mod, study585)
plot(ped_585,main = "SSP585: 2021~2040")
e_585 <- evaluate(mod, p=occ_test, a=bg, x=ssp585_layer)
thd_585 <- threshold(e_585, "no_omission")
Ending
