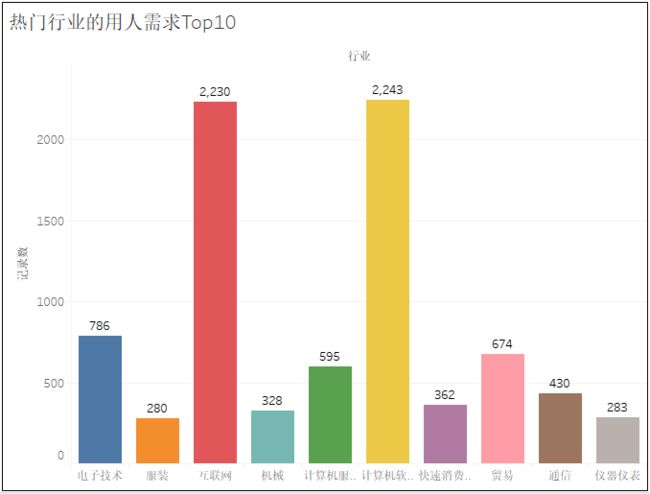
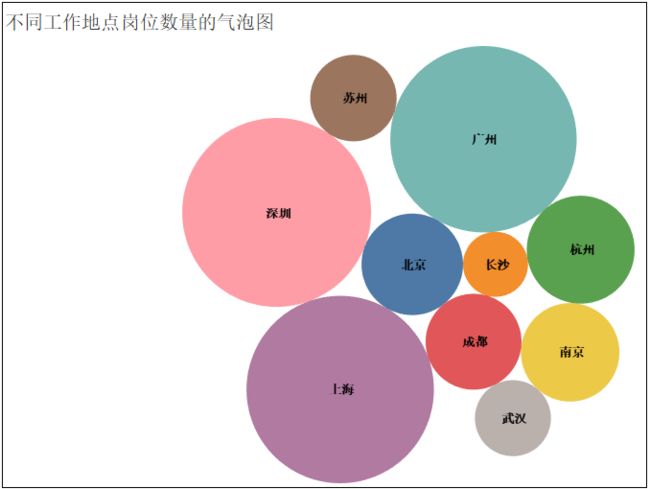
python爬取招聘网站数据,利用tableau可视化交互大屏,指导你如何学习、找工作!
如果觉得文章写得好,如果你想要博客文章中的数据,请关注公众号:【数据分析与统计学之美】,添加作者【个人微信】,进群和作者交流!
目录
1、项目背景
2、信息的爬取(基于51job招聘网站的数据爬取)
1)导入相关库
2)关于翻页的说明
3)完整的爬取代码
3、数据预处理
1)相关库的导入及数据的读取
2)热门城市的岗位数量TOP10
3)岗位名字段的处理
4)工资水平字段的处理
5)工作地点字段的处理
6)公司类型字段的处理
7)行业字段的处理
8)经验与学历字段的处理
9)工作描述字段的处理
10)公司规模字段的处理
11)构造新数据
4、关于“工作描述”字段的特殊处理
5、tableau可视化展示
1) 热门城市的用人需求TOP10
2)热门城市的岗位数量TOP10
3)不同工作地点岗位数量的气泡图
4)热门岗位的薪资待遇
5)热门行业的薪资待遇
6)可视化大屏的最终展示
7)可视化大屏的“动态”展示
本文大纲
1、项目背景
随着科技的飞速发展,数据呈现爆发式的增长,任何人都摆脱不了与数据打交道,社会对于“数据”方面的人才需求也在不断增大。因此了解当下企业究竟需要招聘什么样的人才?需要什么样的技能?不管是对于在校生,还是对于求职者来说,都显得很有必要。
本文基于这个问题,针对51job招聘网站,爬取了全国范围内大数据、数据分析、数据挖掘、机器学习、人工智能等相关岗位的招聘信息。分析比较了不同岗位的薪资、学历要求;分析比较了不同区域、行业对相关人才的需求情况;分析比较了不同岗位的知识、技能要求等。
做完以后的项目效果如下:

动态效果如下:

2、信息的爬取(基于51job招聘网站的数据爬取)
- 爬取岗位:大数据、数据分析、机器学习、人工智能等相关岗位;
- 爬取字段:公司名、岗位名、工作地址、薪资、发布时间、工作描述、公司类型、员工人数、所属行业;
- 说明:基于51job招聘网站,我们搜索全国对于“数据”岗位的需求,大概有2000页。我们爬取的字段,既有一级页面的相关信息,还有二级页面的部分信息;
- 爬取思路:先针对某一页数据的一级页面做一个解析,然后再进行二级页面做一个解析,最后再进行翻页操作;
- 使用工具:Python+requests+lxml+pandas+time
- 网站解析方式:Xpath
1)导入相关库
import requests
import pandas as pd
from pprint import pprint
from lxml import etree
import time
import warnings
warnings.filterwarnings("ignore")
2)关于翻页的说明
# 第一页的特点
https://search.51job.com/list/000000,000000,0000,00,9,99,%25E6%2595%25B0%25E6%258D%25AE,2,1.html?
# 第二页的特点
https://search.51job.com/list/000000,000000,0000,00,9,99,%25E6%2595%25B0%25E6%258D%25AE,2,2.html?
# 第三页的特点
https://search.51job.com/list/000000,000000,0000,00,9,99,%25E6%2595%25B0%25E6%258D%25AE,2,3.html?
注意:通过对于页面的观察,可以看出,就一个地方的数字变化了,因此只需要做字符串拼接,然后循环爬取即可。
3)完整的爬取代码
import requests
import pandas as pd
from pprint import pprint
from lxml import etree
import time
import warnings
warnings.filterwarnings("ignore")

for i in range(1,1501):
    print("正在爬取第" + str(i) + "页的数据")
    url_pre = "https://search.51job.com/list/000000,000000,0000,00,9,99,%25E6%2595%25B0%25E6%258D%25AE,2,"
    url_end = ".html?"
    url = url_pre + str(i) + url_end
    headers = {
        'User-Agent': 'Mozilla/5.0 (Windows NT 10.0; Win64; x64) AppleWebKit/537.36 (KHTML, like Gecko) Chrome/73.0.3683.86 Safari/537.36'
    }
    web = requests.get(url, headers=headers)
    web.encoding = "gbk"
    dom = etree.HTML(web.text)
    # 1、岗位名称
    job_name = dom.xpath('//div[@class="dw_table"]/div[@class="el"]//p/span/a[@target="_blank"]/@title')
    # 2、公司名称
    company_name = dom.xpath('//div[@class="dw_table"]/div[@class="el"]/span[@class="t2"]/a[@target="_blank"]/@title')
    # 3、工作地点
    address = dom.xpath('//div[@class="dw_table"]/div[@class="el"]/span[@class="t3"]/text()')
    # 4、工资
    salary_mid = dom.xpath('//div[@class="dw_table"]/div[@class="el"]/span[@class="t4"]')
    salary = [i.text for i in salary_mid]
    # 5、发布日期
    release_time = dom.xpath('//div[@class="dw_table"]/div[@class="el"]/span[@class="t5"]/text()')
    # 6、获取二级网址url
    deep_url = dom.xpath('//div[@class="dw_table"]/div[@class="el"]//p/span/a[@target="_blank"]/@href')
    RandomAll = []
    JobDescribe = []
    CompanyType = []
    CompanySize = []
    Industry = []
    for i in range(len(deep_url)):
        web_test = requests.get(deep_url[i], headers=headers)
        web_test.encoding = "gbk"
        dom_test = etree.HTML(web_test.text)
        # 7、爬取经验、学历信息,先合在一个字段里面,以后再做数据清洗。命名为random_all
        random_all = dom_test.xpath('//div[@class="tHeader tHjob"]//div[@class="cn"]/p[@class="msg ltype"]/text()')
        # 8、岗位描述性息
        job_describe = dom_test.xpath('//div[@class="tBorderTop_box"]//div[@class="bmsg job_msg inbox"]/p/text()')
        # 9、公司类型
        company_type = dom_test.xpath('//div[@class="tCompany_sidebar"]//div[@class="com_tag"]/p[1]/@title')
        # 10、公司规模(人数)
        company_size = dom_test.xpath('//div[@class="tCompany_sidebar"]//div[@class="com_tag"]/p[2]/@title')
        # 11、所属行业(公司)
        industry = dom_test.xpath('//div[@class="tCompany_sidebar"]//div[@class="com_tag"]/p[3]/@title')
        # 将上述信息保存到各自的列表中
        RandomAll.append(random_all)
        JobDescribe.append(job_describe)
        CompanyType.append(company_type)
        CompanySize.append(company_size)
        Industry.append(industry)
        # 为了反爬,设置睡眠时间
        time.sleep(1)
    # 由于我们需要爬取很多页,为了防止最后一次性保存所有数据出现的错误,因此,我们每获取一夜的数据,就进行一次数据存取。
    df = pd.DataFrame()
    df["岗位名称"] = job_name
    df["公司名称"] = company_name
    df["工作地点"] = address
    df["工资"] = salary
    df["发布日期"] = release_time
    df["经验、学历"] = RandomAll
    df["公司类型"] = CompanyType
    df["公司规模"] = CompanySize
    df["所属行业"] = Industry
    df["岗位描述"] = JobDescribe
    # 这里在写出过程中,有可能会写入失败,为了解决这个问题,我们使用异常处理。
    try:
        df.to_csv("job_info.csv", mode="a+", header=None, index=None, encoding="gbk")
    except:
        print("当页数据写入失败")
    time.sleep(1)
print("数据爬取完毕,是不是很开心!!!")
这里可以看到,我们爬取了1000多页的数据做最终的分析。因此每爬取一页的数据,做一次数据存储,避免最终一次性存储导致失败。同时根据自己的测试,有一些页数进行数据存储,会导致失败,为了不影响后面代码的执行,我们使用了“try-except”异常处理。
在一级页面中,我们爬取了“岗位名称”,“公司名称”,“工作地点”,“工资”,“发布日期”,“二级网址的url”这几个字段。
在二级页面中,我们爬取了“经验、学历信息”,“岗位描述”,“公司类型”,“公司规模”,“所属行业”这几个字段。
3、数据预处理
从爬取到的数据中截取部分做了一个展示,可以看出数据很乱。杂乱的数据并不利于我们的分析,因此需要根据研究的目标做一个数据预处理,得到我们最终可以用来做可视化展示的数据。
1)相关库的导入及数据的读取
df = pd.read_csv(r"G:\8泰迪\python_project\51_job\job_info1.csv",engine="python",header=None)
# 为数据框指定行索引
df.index = range(len(df))
# 为数据框指定列索引
df.columns = ["岗位名","公司名","工作地点","工资","发布日期","经验与学历","公司类型","公司规模","行业","工作描述"]
2)数据去重
- 我们认为一个公司的公司名和和发布的岗位名一致,就看作是重复值。因此,使用drop_duplicates(subset=[])函数,基于“岗位名”和“公司名”做一个重复值的剔除。
# 去重之前的记录数
print("去重之前的记录数",df.shape)
# 记录去重
df.drop_duplicates(subset=["公司名","岗位名"],inplace=True)
# 去重之后的记录数
print("去重之后的记录数",df.shape)
3)岗位名字段的处理
① 岗位名字段的探索
df["岗位名"].value_counts()
df["岗位名"] = df["岗位名"].apply(lambda x:x.lower())
说明:首先我们对每个岗位出现的频次做一个统计,可以看出“岗位名字段”太杂乱,不便于我们做统计分析。接着我们将岗位名中的大写英文字母统一转换为小写字母,也就是说“AI”和“Ai”属于同一个东西。
② 构造想要分析的目标岗位,做一个数据筛选
job_info.shape
target_job = ['算法', '开发', '分析', '工程师', '数据', '运营', '运维']
index = [df["岗位名"].str.count(i) for i in target_job]
index = np.array(index).sum(axis=0) > 0
job_info = df[index]
job_info.shape
说明:首先我们构造了如上七个目标岗位的关键字眼。然后利用count()函数统计每一条记录中,是否包含这七个关键字眼,如果包含就保留这个字段,不过不包含就删除这个字段。最后查看筛选之后还剩余多少条记录。
③ 目标岗位标准化处理(由于目标岗位太杂乱,我们需要统一一下)
job_list = ['数据分析', "数据统计","数据专员",'数据挖掘', '算法',
            '大数据','开发工程师', '运营', '软件工程', '前端开发',
            '深度学习', 'ai', '数据库', '数据库', '数据产品',
            '客服', 'java', '.net', 'andrio', '人工智能', 'c++',
            '数据管理',"测试","运维"]
job_list = np.array(job_list)
def rename(x=None,job_list=job_list):
    index = [i in x for i in job_list]
    if sum(index) > 0:
        return job_list[index][0]
    else:
        return x
job_info["岗位名"] = job_info["岗位名"].apply(rename)
job_info["岗位名"].value_counts()
# 数据统计、数据专员、数据分析统一归为数据分析
job_info["岗位名"] = job_info["岗位名"].apply(lambda x:re.sub("数据专员","数据分析",x))
job_info["岗位名"] = job_info["岗位名"].apply(lambda x:re.sub("数据统计","数据分析",x))
说明:首先我们定义了一个想要替换的目标岗位job_list,将其转换为ndarray数组。然后定义一个函数,如果某条记录包含job_list数组中的某个关键词,那么就将该条记录替换为这个关键词,如果某条记录包含job_list数组中的多个关键词,我们只取第一个关键词替换该条记录。接着使用value_counts()函数统计一下替换后的各岗位的频次。最后,我们将“数据专员”、“数据统计”统一归为“数据分析”。
4)工资水平字段的处理
- 工资水平字段的数据类似于“20-30万/年”、“2.5-3万/月”和“3.5-4.5千/月”这样的格式。我们需要做一个统一的变化,将数据格式转换为“元/月”,然后取出这两个数字,求一个平均值。
job_info["工资"].str[-1].value_counts()
job_info["工资"].str[-3].value_counts()

index1 = job_info["工资"].str[-1].isin(["年","月"])
index2 = job_info["工资"].str[-3].isin(["万","千"])
job_info = job_info[index1 & index2]

def get_money_max_min(x):
    try:
        if x[-3] == "万":
            z = [float(i)*10000 for i in re.findall("[0-9]+\.?[0-9]*",x)]
        elif x[-3] == "千":
            z = [float(i) * 1000 for i in re.findall("[0-9]+\.?[0-9]*", x)]
        if x[-1] == "年":
            z = [i/12 for i in z]
        return z
    except:
        return x

salary = job_info["工资"].apply(get_money_max_min)
job_info["最低工资"] = salary.str[0]
job_info["最高工资"] = salary.str[1]
job_info["工资水平"] = job_info[["最低工资","最高工资"]].mean(axis=1)
说明:首先我们做了一个数据筛选,针对于每一条记录,如果最后一个字在“年”和“月”中,同时第三个字在“万”和“千”中,那么就保留这条记录,否则就删除。接着定义了一个函数,将格式统一转换为“元/月”。最后将最低工资和最高工资求平均值,得到最终的“工资水平”字段。
5)工作地点字段的处理
- 由于整个数据是关于全国的数据,涉及到的城市也是特别多。我们需要自定义一个常用的目标工作地点字段,对数据做一个统一处理。
#job_info["工作地点"].value_counts()
address_list = ['北京', '上海', '广州', '深圳', '杭州', '苏州', '长沙',
                '武汉', '天津', '成都', '西安', '东莞', '合肥', '佛山',
                '宁波', '南京', '重庆', '长春', '郑州', '常州', '福州',
                '沈阳', '济南', '宁波', '厦门', '贵州', '珠海', '青岛',
                '中山', '大连','昆山',"惠州","哈尔滨","昆明","南昌","无锡"]
address_list = np.array(address_list)

def rename(x=None,address_list=address_list):
    index = [i in x for i in address_list]
    if sum(index) > 0:
        return address_list[index][0]
    else:
        return x
job_info["工作地点"] = job_info["工作地点"].apply(rename)
说明:首先我们定义了一个目标工作地点列表,将其转换为ndarray数组。接着定义了一个函数,将原始工作地点记录,替换为目标工作地点中的城市。
6)公司类型字段的处理
- 这个很容易,就不详细说明了。
job_info.loc[job_info["公司类型"].apply(lambda x:len(x)<6),"公司类型"] = np.nan
job_info["公司类型"] = job_info["公司类型"].str[2:-2]
7)行业字段的处理
- 每个公司的行业字段可能会有多个行业标签,但是我们默认以第一个作为该公司的行业标签。
# job_info["行业"].value_counts()
job_info["行业"] = job_info["行业"].apply(lambda x:re.sub(",","/",x))
job_info.loc[job_info["行业"].apply(lambda x:len(x)<6),"行业"] = np.nan
job_info["行业"] = job_info["行业"].str[2:-2].str.split("/").str[0]
8)经验与学历字段的处理
- 关于这个字段的数据处理,我很是思考了一会儿,不太好叙述,放上代码自己下去体会。
job_info["学历"] = job_info["经验与学历"].apply(lambda x:re.findall("本科|大专|应届生|在校生|硕士",x))
def func(x):
    if len(x) == 0:
        return np.nan
    elif len(x) == 1 or len(x) == 2:
        return x[0]
    else:
        return x[2]
job_info["学历"] = job_info["学历"].apply(func)
9)工作描述字段的处理
- 对于每一行记录,我们去除停用词以后,做一个jieba分词。
with open(r"G:\8泰迪\python_project\51_job\stopword.txt","r") as f:
    stopword = f.read()
stopword = stopword.split()
stopword = stopword + ["任职","职位"," "]

job_info["工作描述"] = job_info["工作描述"].str[2:-2].apply(lambda x:x.lower()).apply(lambda x:"".join(x))\
    .apply(jieba.lcut).apply(lambda x:[i for i in x if i not in stopword])
job_info.loc[job_info["工作描述"].apply(lambda x:len(x) < 6),"工作描述"] = np.nan
10)公司规模字段的处理
#job_info["公司规模"].value_counts()
def func(x):
    if x == "['少于50人']":
        return "<50"
    elif x == "['50-150人']":
        return "50-150"
    elif x == "['150-500人']":
        return '150-500'
    elif x == "['500-1000人']":
        return '500-1000'
    elif x == "['1000-5000人']":
        return '1000-5000'
    elif x == "['5000-10000人']":
        return '5000-10000'
    elif x == "['10000人以上']":
        return ">10000"
    else:
        return np.nan
job_info["公司规模"] = job_info["公司规模"].apply(func)
11)构造新数据
- 我们针对最终清洗干净的数据,选取需要分析的字段,做一个数据存储。
feature = ["公司名","岗位名","工作地点","工资水平","发布日期","学历","公司类型","公司规模","行业","工作描述"]
final_df = job_info[feature]
final_df.to_excel(r"G:\8泰迪\python_project\51_job\词云图.xlsx",encoding="gbk",index=None)
4、关于“工作描述”字段的特殊处理
- 由于我们之后需要针对不同的岗位名做不同的词云图处理,并且是在tableau中做可视化展示,因此我们需要按照岗位名分类,求出不同岗位下各关键词的词频统计。
import numpy as np
import pandas as pd
import re
import jieba
import warnings
warnings.filterwarnings("ignore")

df = pd.read_excel(r"G:\8泰迪\python_project\51_job\new_job_info1.xlsx",encoding="gbk")
df

def get_word_cloud(data=None, job_name=None):
    words = []
    describe = data['工作描述'][data['岗位名'] == job_name].str[1:-1]
    describe.dropna(inplace=True)
    [words.extend(i.split(',')) for i in describe]
    words = pd.Series(words)
    word_fre = words.value_counts()
    return word_fre

zz = ['数据分析', '算法', '大数据','开发工程师', '运营', '软件工程','运维', '数据库','java',"测试"]
for i in zz:
    word_fre = get_word_cloud(data=df, job_name='{}'.format(i))
    word_fre = word_fre[1:].reset_index()[:100]
    word_fre["岗位名"] = pd.Series("{}".format(i),index=range(len(word_fre)))
    word_fre.to_csv(r"G:\8泰迪\python_project\51_job\词云图\bb.csv", mode='a',index=False, header=None,encoding="gbk")


