数据集COCO在目标检测的介绍与使用
COCO数据集介绍
COCO数据集主页:http://cocodataset.org
COCO数据集是大规模的数据集,用于Object Detection + Segmentation + Localization + Captioning。
数据集下载:http://cocodataset.org/#download
目前常用的是2017 Train images [118K/18GB]和2017 Val images [5K/1GB]。这些图片可以对应如下的标注信息应用:
2017 Train/Val annotations [241MB]:
- instances:目标检测
- captions:图像描述
- person_keypoints:关键点检测
2017 Stuff Train/Val annotations [1.1GB]: 素材分割(Stuff Segmentation)
2017 Panoptic Train/Val annotations [821MB]: 全景分割(Panoptic Segmentation)
还有测试集2017 Test images [41K/6GB],这部分数据不知道annotations,分为test-dev集和test集,相当于A,B榜,前者可以提交到evaluation server去查看结果并得到反馈,后者用于评判最终的比赛结果。
五部分json格式的详细信息可见如下链接:http://cocodataset.org/#format-data
在这里重点Object Detection相关的标注信息:
annotation{
    "id": int,
    "image_id": int,
    "category_id": int,
    "segmentation": RLE or [polygon],
    "area": float,
    "bbox": [x,y,width,height],
    "iscrowd": 0 or 1,
}

categories[{
    "id": int,
    "name": str,
    "supercategory": str,
}]
每个对象实例的标注都包含一系列字段,包括对象的类别ID(category_id)和分段掩码(segmentation)。 segmentation的编码格式取决于实例是表示单个对象(iscrowd = 0,在这种情况下使用polygen)还是对象集合(iscrowd = 1,在这种情况下使用RLE)。 请注意,单个对象(iscrowd = 0)可能需要多个多边形,例如,如果被遮挡。 人群注释(iscrowd = 1)用于标记大组对象(例如一群人)。 此外,为每个对象提供一个封闭的边界框(框坐标是从左上角的图像角测量的,并且是0索引的)。 其中“bbox”属性为实例的边界框(bounding box)。这四个数字的含义为左上角横坐标、左上角纵坐标、宽度、高度,这个框为大致画出。最后,标注结构的 categories 字段存储 category id 到 category 和 supercategory 名称的映射。
Object Detection Metrics
参考链接:http://cocodataset.org/#detection-eval
计算mAP
参考链接:https://blog.csdn.net/l7H9JA4/article/details/80745028
训练好的目标检测模型会给出大量的预测结果,但是其中大多数的预测值都会有非常低的置信度(confidence score),因此我们只考虑那些置信度高于某个阈值的预测结果。为了获得True Positives and False Positives,我们需要使用IoU。计算IoU,我们从而确定一个检测结果(Positive)是正确的(True)还是错误的(False)。最常用的阈值是0.5,即如果IoU> 0.5,则认为它是True Positive,否则认为是False Positive。而COCO数据集的评估指标建议对不同的IoU阈值进行计算,但为简单起见,我们这里仅讨论一个阈值0.5,这是PASCAL VOC数据集所用的指标。
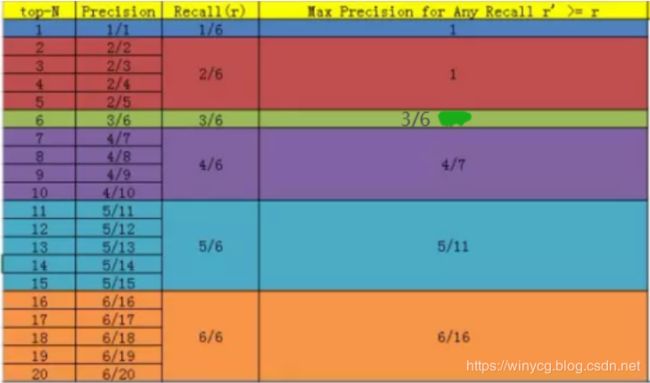
以下给出一个样例,假设一共有6个正样本需要被预测到,则可以根据置信度得到所有样本的预测排序,以下的例子中在第20位才能全部预测到6个样本。
11-point interpolated AP
VOC数据集在2007年提出的mAP计算方法。首先设定一组阈值,[0, 0.1, 0.2, …, 1],对于每一个recall值 r ∈ [ 0 , 0.1 , 0.2 , … , 1 ] r\in [0, 0.1, 0.2, …, 1] r∈[0,0.1,0.2,…,1],在满足, r ~ ≥ r \tilde{r}\geq r r~≥r取 r ~ \tilde{r} r~中对应的最大precision, r ~ \tilde{r} r~即:
p i n t e r ( r ) = max r ~ : r ~ ≥ r p ( r ~ ) p_{inter}(r)=\max_{\tilde{r}:\tilde{r}\geq r}p(\tilde{r}) pinter(r)=r~:r~≥rmaxp(r~)
根据上图的实际数据, r ~ = [ 1 / 6 , 2 / 6 , 3 / 6 , … , 6 / 6 ] \tilde{r}=[1/6, 2/6, 3/6, …, 6/6] r~=[1/6,2/6,3/6,…,6/6],对应的 p i n t e r ( r ) = [ 1 , 1 , 1 , 1 , 3 / 6 , 3 / 6 , 4 / 7 , 5 / 11 , 5 / 11 , 6 / 16 , 6 / 16 ] p_{inter}(r)=[1,1,1,1,3/6,3/6,4/7,5/11,5/11,6/16,6/16] pinter(r)=[1,1,1,1,3/6,3/6,4/7,5/11,5/11,6/16,6/16]
将11组阈值对应的precision求平均即可得到AP A P = 1 11 ∑ r ∈ [ 0 , 0.1 , 0.2 , … , 1 ] p i n t e r ( r ) AP=\frac{1}{11}\sum_{r\in [0, 0.1, 0.2, …, 1]}p_{inter}(r) AP=111r∈[0,0.1,0.2,…,1]∑pinter(r)
AP衡量的是学出来的模型在每个类别上的好坏,mAP衡量的是学出的模型在所有类别上的好坏,得到AP后mAP的计算就变得很简单了,就是取所有AP的平均值
2010新方法
VOC数据集在2010之后却使用了所有数据点,而不是仅使用11个recall值来计算AP。对 m m m个正例,那么我们会得到 m m m个recall值 ( 1 m , 2 m , . . . , m m , ) (\frac{1}{m},\frac{2}{m},...,\frac{m}{m},) (m1,m2,...,mm,),对于每个recall值 r r r,我们可以计算出对应 r ~ > r \tilde{r}> r r~>r的最大precision,然后对这 m m m个precision值取平均即得到最后的AP值。对于上述用例来说,最终的AP为: A P = 1 11 [ 1 + 1 + 3 / 6 + 4 / 7 + 5 / 11 + 6 / 16 ] AP=\frac{1}{11}[1+1+3/6+4/7+5/11+6/16] AP=111[1+1+3/6+4/7+5/11+6/16]
COCO指标
COCO给出了如下的12个指标可以使用:
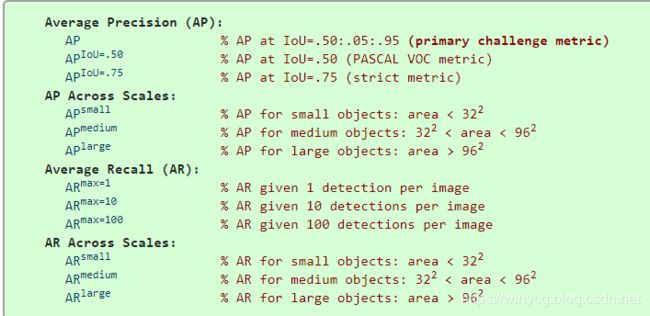
以上的AP全都代表mAP,10 IoU thresholds of .50:.05:.95.的平均为最终的mAP。small,medium和large根据面积分为小,中和大目标,area用segmentation mask的像素数来衡量。AR is the maximum recall given a fixed number of detections per image,AR代表最大的recall值在给定检测次数的情况下。
来自COCO官方实例:
(1)导入包
import matplotlib.pyplot as plt
from pycocotools.coco import COCO
from pycocotools.cocoeval import COCOeval
import numpy as np
import skimage.io as io
import pylab
pylab.rcParams['figure.figsize'] = (10.0, 8.0)
(2)以目标检测框bbox为例:
annType = ['segm','bbox','keypoints']
annType = annType[1]      #specify type here
prefix = 'person_keypoints' if annType=='keypoints' else 'instances'
print 'Running demo for *%s* results.'%(annType)
(3)初始化COCO ground truth文件:
#initialize COCO ground truth api
dataDir='../'
dataType='val2014'
annFile = '%s/annotations/%s_%s.json'%(dataDir,prefix,dataType)
cocoGt=COCO(annFile)
(4)设定结果文件路径
#initialize COCO detections api
resFile='%s/results/%s_%s_fake%s100_results.json'
resFile = resFile%(dataDir, prefix, dataType, annType)
cocoDt=cocoGt.loadRes(resFile)
(5)取出前100张并进行打乱:
imgIds=sorted(cocoGt.getImgIds())
imgIds=imgIds[0:100]
imgId = imgIds[np.random.randint(100)]
(6)进行评测
# running evaluation
cocoEval = COCOeval(cocoGt,cocoDt,annType)
cocoEval.params.imgIds  = imgIds
cocoEval.evaluate()
cocoEval.accumulate()
cocoEval.summarize()
输出结果:
Running per image evaluation...
DONE (t=0.46s).
Accumulating evaluation results...
DONE (t=0.38s).
 Average Precision  (AP) @[ IoU=0.50:0.95 | area=   all | maxDets=100 ] = 0.505
 Average Precision  (AP) @[ IoU=0.50      | area=   all | maxDets=100 ] = 0.697
 Average Precision  (AP) @[ IoU=0.75      | area=   all | maxDets=100 ] = 0.573
 Average Precision  (AP) @[ IoU=0.50:0.95 | area= small | maxDets=100 ] = 0.586
 Average Precision  (AP) @[ IoU=0.50:0.95 | area=medium | maxDets=100 ] = 0.519
 Average Precision  (AP) @[ IoU=0.50:0.95 | area= large | maxDets=100 ] = 0.501
 Average Recall     (AR) @[ IoU=0.50:0.95 | area=   all | maxDets=  1 ] = 0.387
 Average Recall     (AR) @[ IoU=0.50:0.95 | area=   all | maxDets= 10 ] = 0.594
 Average Recall     (AR) @[ IoU=0.50:0.95 | area=   all | maxDets=100 ] = 0.595
 Average Recall     (AR) @[ IoU=0.50:0.95 | area= small | maxDets=100 ] = 0.640
 Average Recall     (AR) @[ IoU=0.50:0.95 | area=medium | maxDets=100 ] = 0.566
 Average Recall     (AR) @[ IoU=0.50:0.95 | area= large | maxDets=100 ] = 0.564